An Hour with Azure SRE Agent
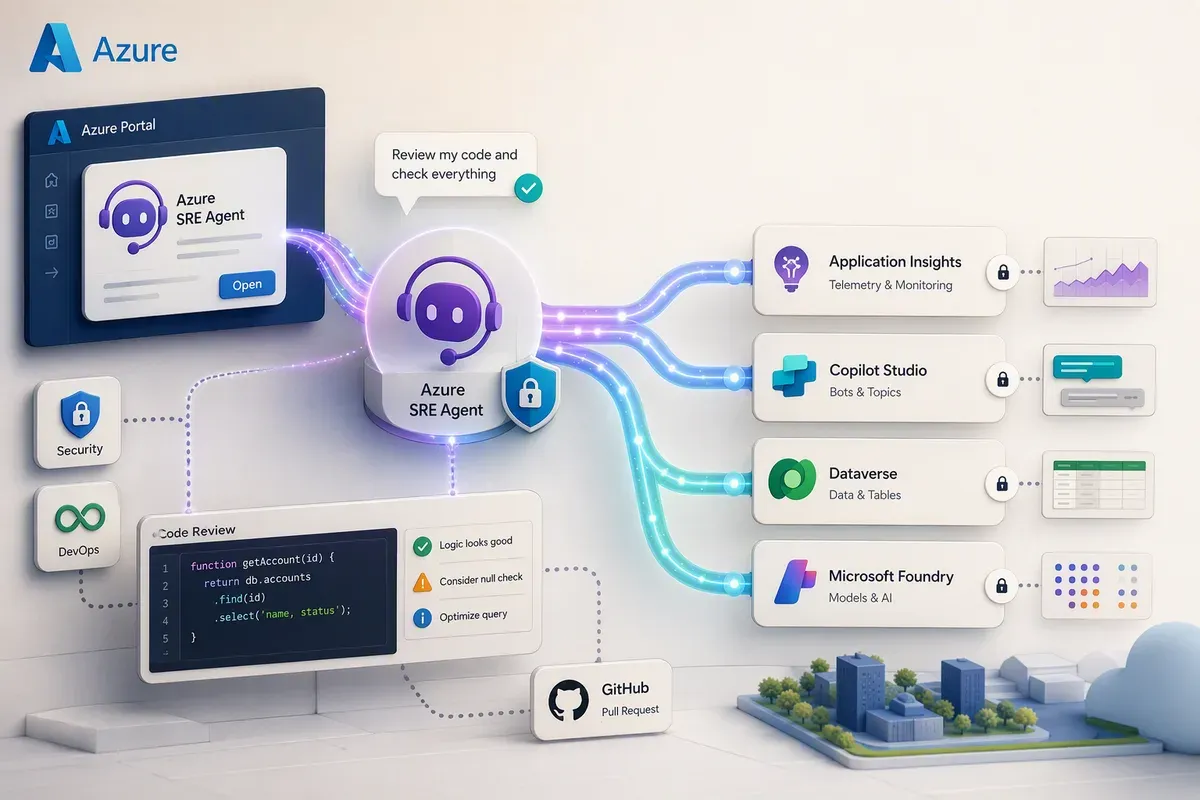
Azure Site Reliability Engineering (“Azure SRE”) Agent is the operations agent for the work that eats an on-call rotation: triaging incidents, checking whether services are actually healthy, and running the runbook nobody has updated since the last reorg. It went generally available in March 2026, and if you haven’t tried it yet, the short version is that it does the first twenty minutes of an investigation for you and shows its work.
I gave it an hour. In that hour it reviewed one of my repos and handed back findings that went well past the usual security scan into performance, accessibility, and UX. Then I asked it what my Application Insights instances were actually recording, and it surfaced unhealthy telemetry from Dataverse, Copilot Studio, a couple of app servers, and a Foundry agent in a single pass.
Here’s what it is, what it can do, and where I’d be careful with it.
Before any of that, one thing to read alongside this post. Shamir Abdul Aziz, a principal product manager at Microsoft on the team that builds this, has just published Zero Ops: Agents Operate, Humans Govern, a design guide for running agentic operations as a governed practice rather than a demo. It’s the first framework I’ve seen that treats context, governance, and measurement as the product and the agent itself as an implementation detail. Read it as a framework rather than as documentation: it’s a design perspective, written by someone who works on the product every day.
I’ve folded its recommendations into this post where they land, and checked its product claims against Microsoft Learn while I did. In three places the guide describes where things are heading and Microsoft Learn describes where they are today. I’ve noted those where they come up so you can check the current docs before you design around them.
What Azure SRE Agent is
It connects your observability tools, incident platforms, and source repositories into one workflow. Instead of hopping between a dashboard, PagerDuty, and Slack when something breaks, you get a single investigation with the “what changed, what’s affected, what to do next” already worked out.
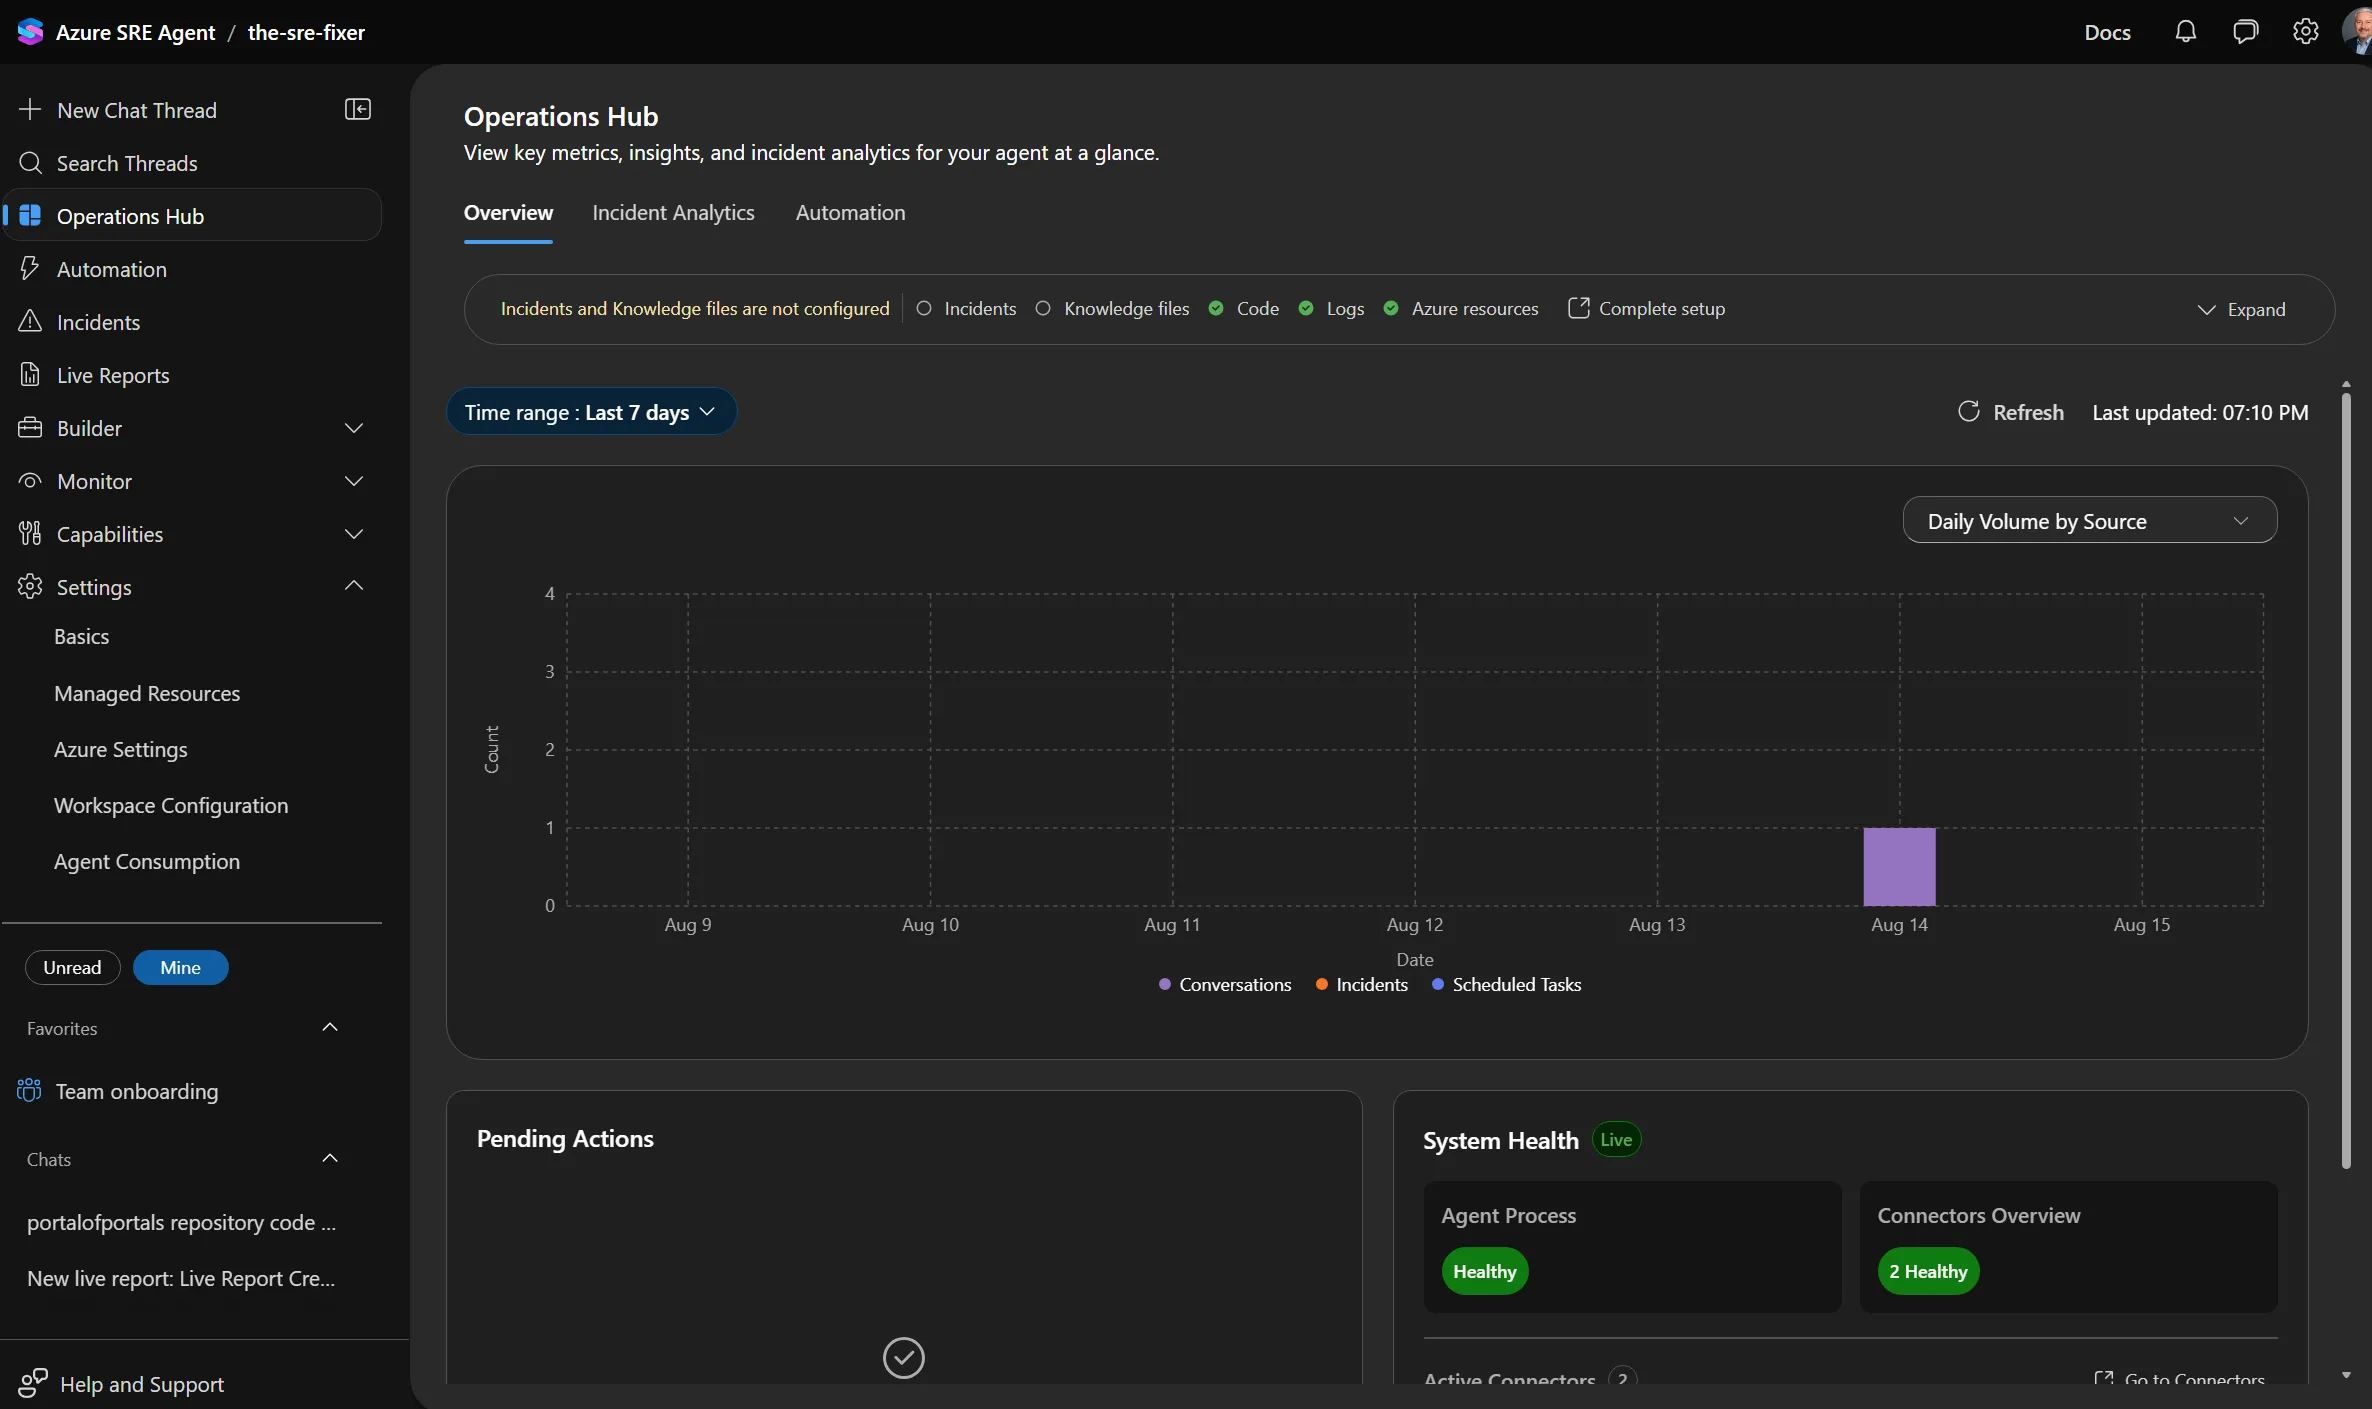
It ships with six built-in subagents — Explore, Plan, CodeReview, Bash, Verification, and GeneralPurpose — plus extension points for custom skills, Python tools, MCP server connections, and event-triggered hooks. Native Application Insights and Log Analytics connectors have since landed, and they handle the RBAC wiring for you, so telemetry is queryable the moment you connect a resource instead of after a separate permissions project.
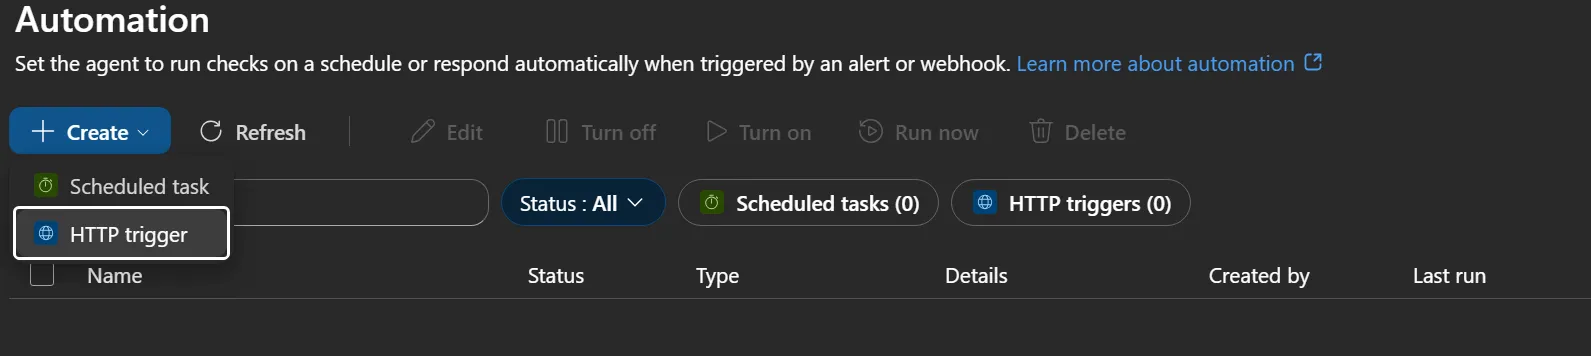
Those hooks aren’t something you script yourself. The Automation blade takes two kinds of trigger: a scheduled task that runs a check on a cadence you set, or an HTTP trigger you point an alert rule or webhook at, so an Azure Monitor alert can start the investigation before anyone opens a laptop.
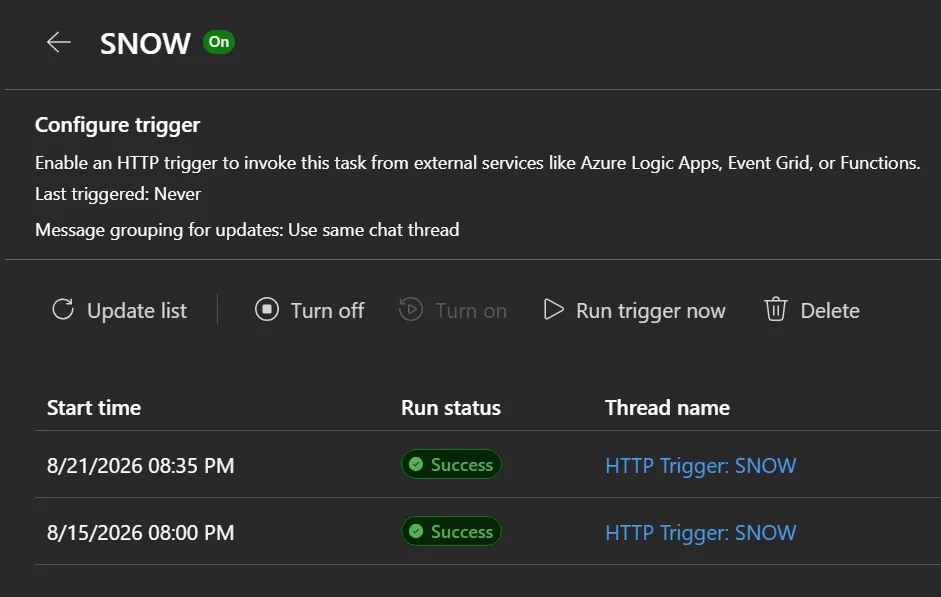
Pick the HTTP trigger and you get an endpoint to hand to Logic Apps, Event Grid, a Function, or anything else that can POST. The trigger keeps its own run history, there’s a Run trigger now button so you can fire it yourself before wiring a real alert to it, and a message-grouping setting that decides whether repeated fires land in one chat thread or spawn a new one each time. One quirk worth not chasing: mine reported “Last triggered: Never” while listing two successful runs directly underneath. Trust the run table.
By default, nothing it proposes deploys without a human approving it first, and that default earns its keep: out of the box this is an agent that recommends and drafts, not one that reboots your production database because it decided that was a good idea at 3 a.m.
Read “by default” literally, though. Autonomy is a setting, not a property of the product. A response plan or a scheduled task switched to autonomous will act without asking you, up to and including scaling a production app in the middle of an incident. I’ve got a worked example of exactly that further down.
The mechanics of the guardrail are straightforward: the agent explains what it intends to do and why before acting, every interaction produces a full audit trail, routine operations run autonomously, and anything flagged as high-impact pauses for in-workflow sign-off. There’s a network layer underneath all of that as well, which I get into further down. See Rethinking cloud operations with Azure SRE Agent for the full picture.
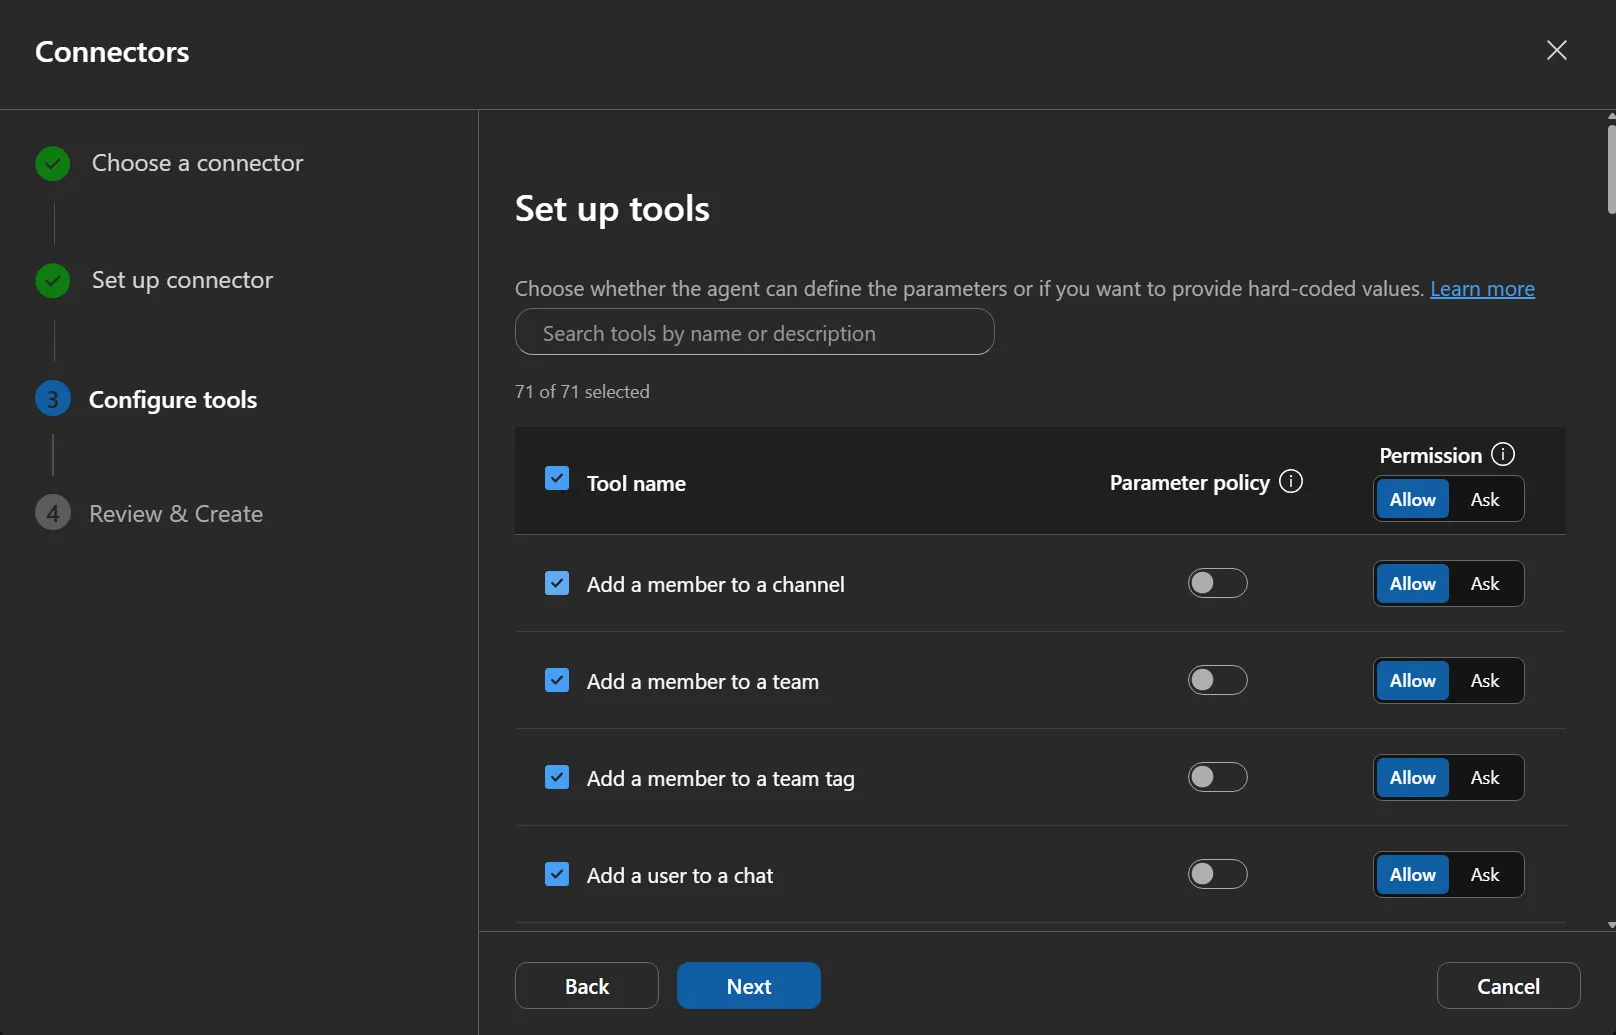
You set that approval model before anything runs. When you wire up a connector, every tool it exposes gets its own permission: Allow lets the agent call it unattended, Ask forces a prompt each time. The Microsoft Teams connector I set up exposes 71 tools, and they’re individually switchable rather than a single all-or-nothing grant. If you’re rolling this out to a team, that page is where you decide what the agent can do on its own and what it has to ask about.
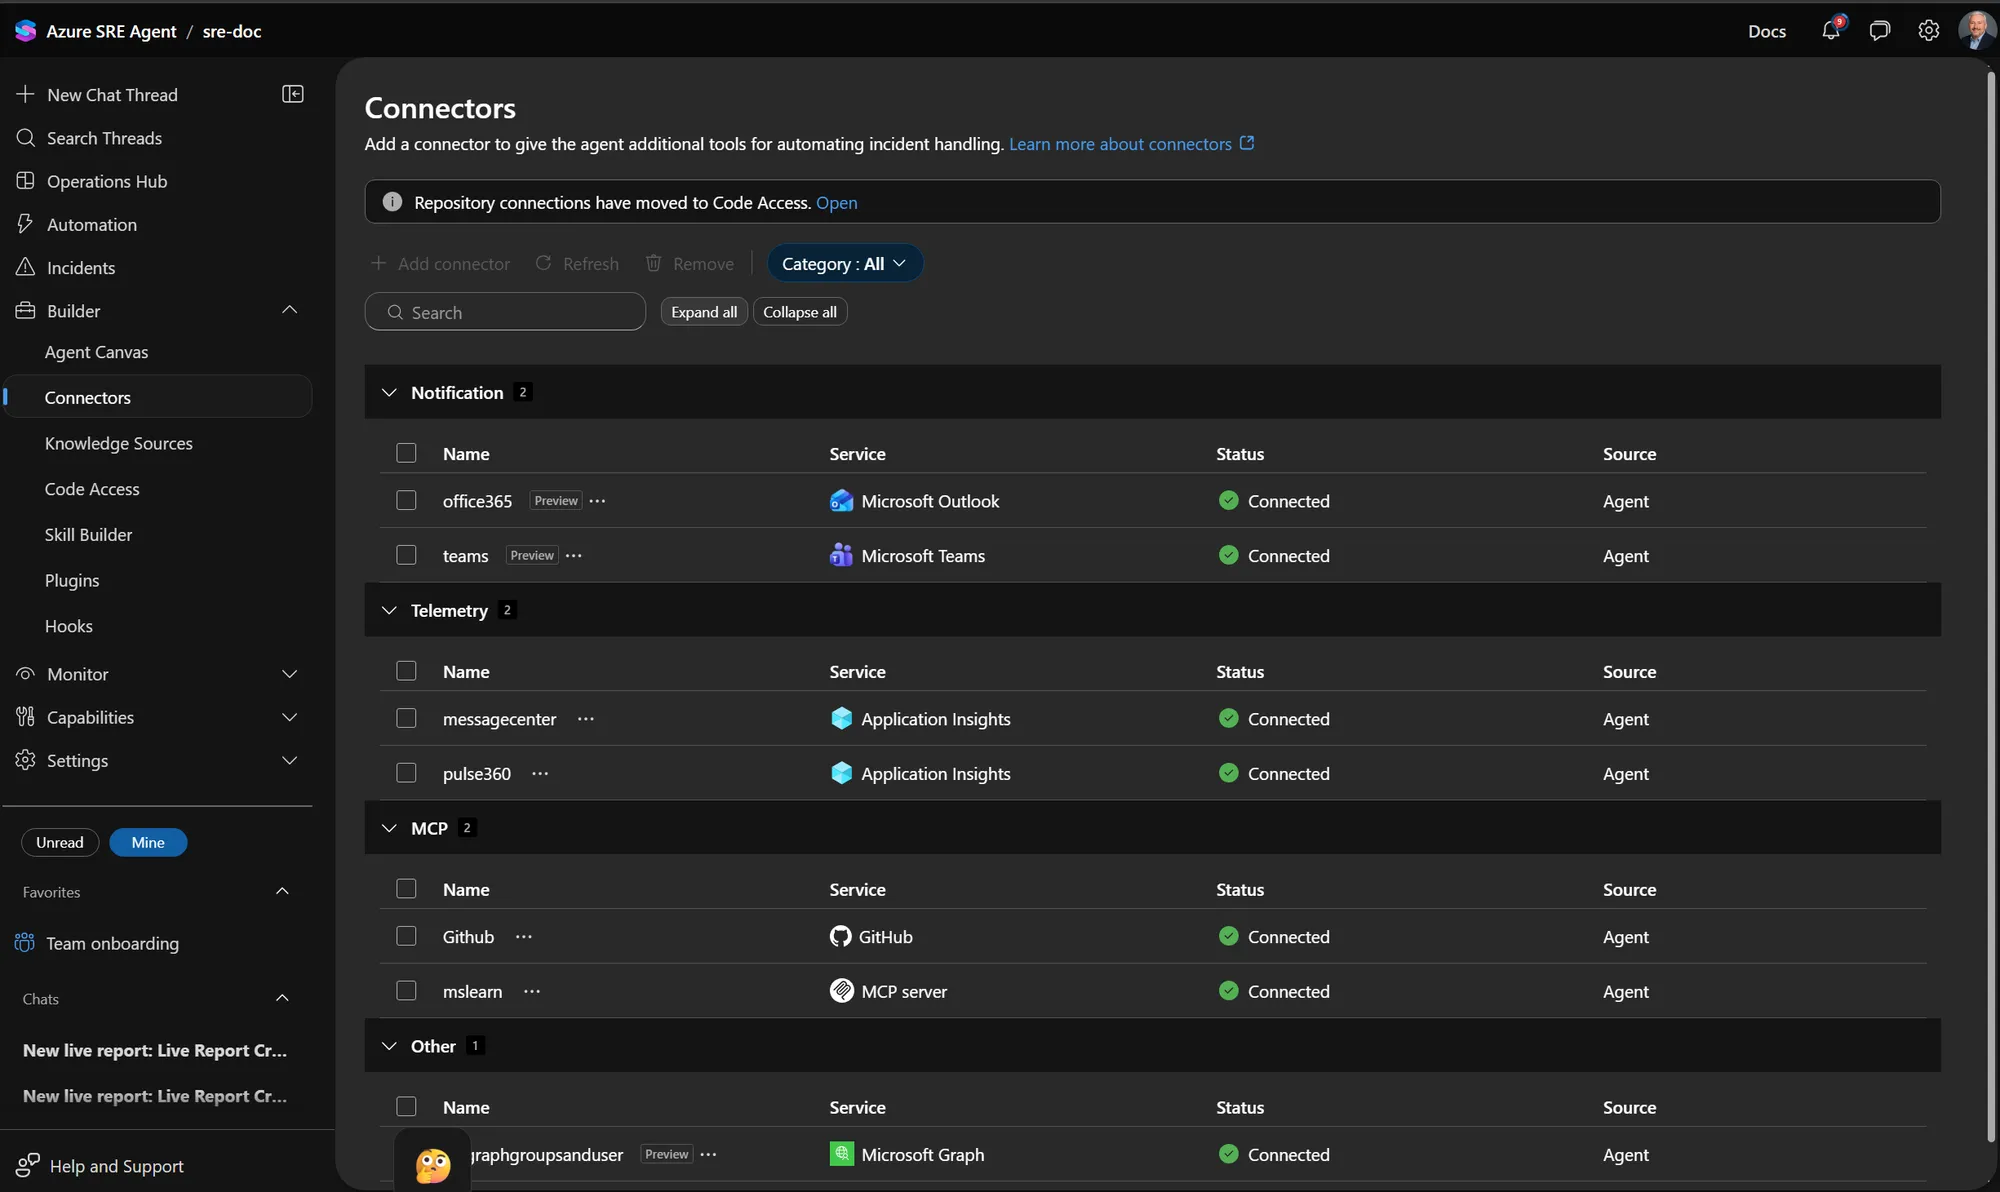
Once they’re in place, the Connectors blade groups everything by category — Notification, Telemetry, MCP, Other — with a status per connector. Mine ended up with Outlook and Teams for notification, two Application Insights connections for telemetry, GitHub and Microsoft Learn as MCP servers, and Microsoft Graph filed under Other. Worth noticing what isn’t there: repository connections moved out to Code Access, and the blade tells you so rather than leaving you hunting.
Those extension points aren’t purely theoretical. It comes with a plugin
marketplace so you’re not building every skill from zero: it lets you browse
and install community and internal skills and MCP integrations from
GitHub-hosted repositories, including private repos and GitHub Enterprise.
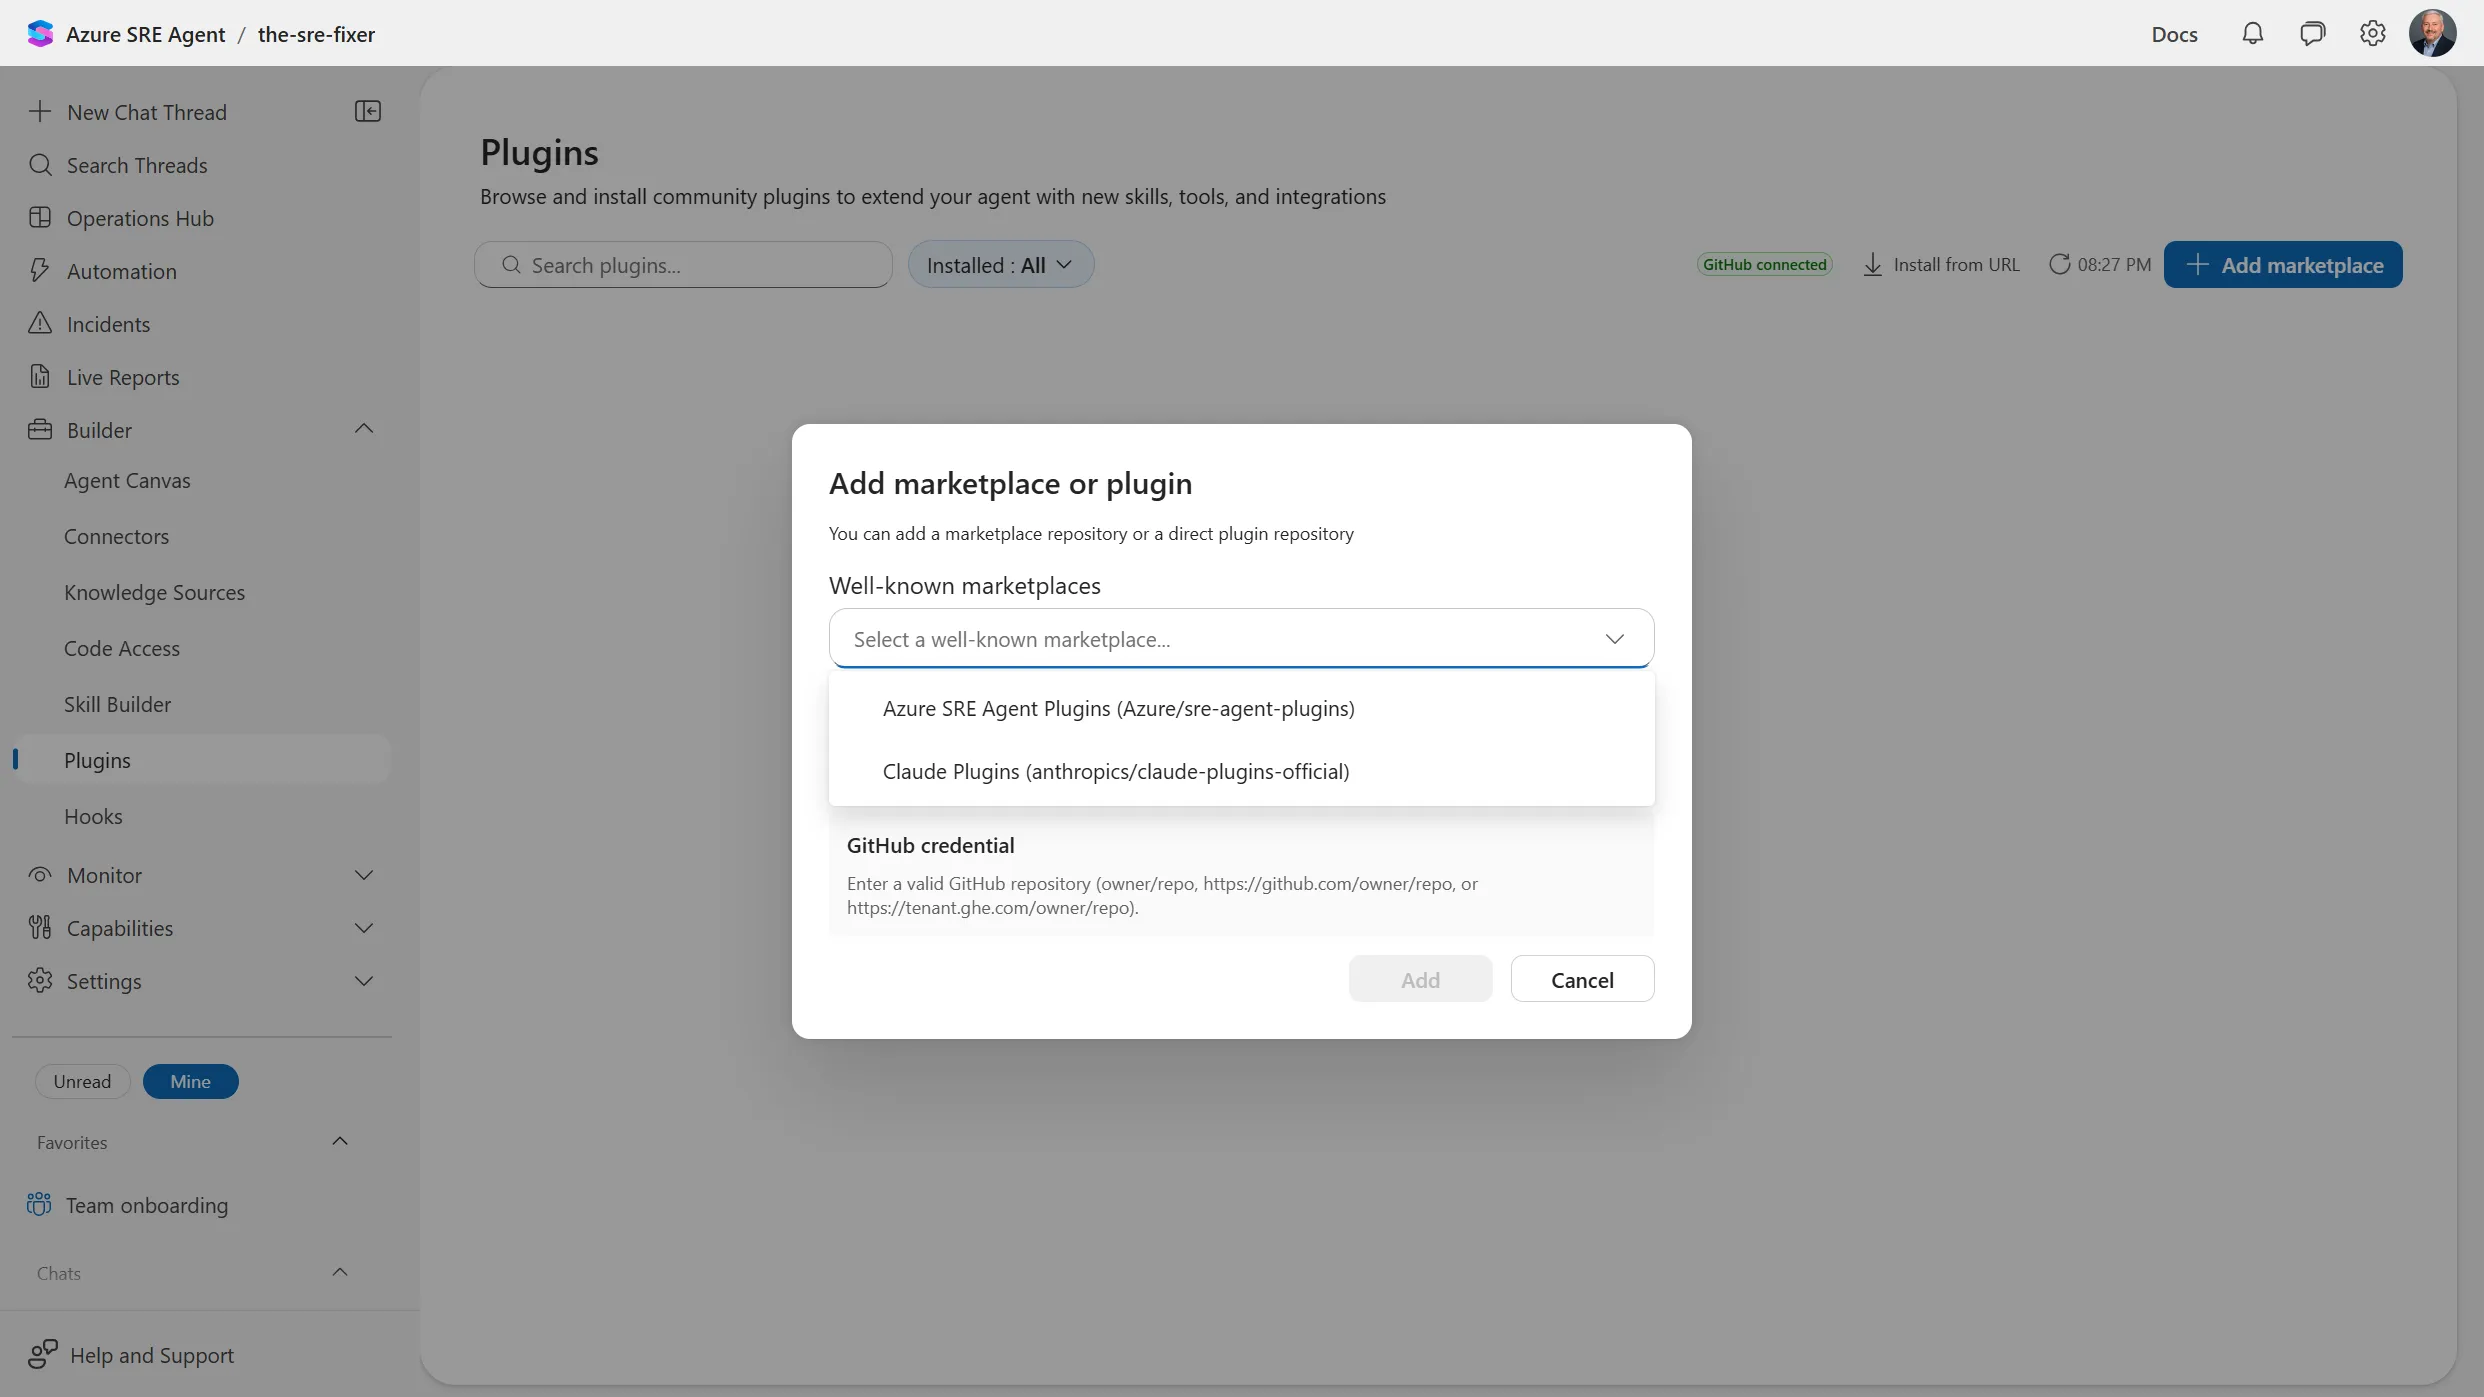
Worth knowing before you go looking for it: a new agent has no marketplace
registered at all, and the Plugins blade sits empty until you add one. The
Add marketplace dialog offers two well-known ones as presets: Azure’s own
Azure SRE Agent Plugins and
Anthropic’s Claude Plugins.
You can also point it at any other repo by owner/repo, a github.com URL,
or a tenant.ghe.com URL. Every install is pinned to a specific git commit,
so an upstream change to a skill you installed months ago doesn’t quietly
alter your agent’s behavior until you choose to update it.
One thing worth flagging if you’re the one managing this for a team: private marketplaces store a single credential — an OAuth token, a personal access token, or a GitHub App — at the marketplace level, and every install from that marketplace uses it. SRE Agent checks that the stored credential can read the repo, not that the person installing the plugin personally has access to it. Anyone with the Author or Administrator role on the agent can install from any registered marketplace, regardless of their own GitHub permissions. If you need to lock that down, the control point is the agent’s RBAC roles, not GitHub repo access.
What setup actually looks like
An agent is an Azure resource, so it starts where every Azure resource starts: a subscription, a resource group, and a region. You create it from the agent list at sre.azure.com, and once it exists it shows up alongside any others you have, region and all. Mine live in two different regions because I built them at different times and never went back to tidy that up.
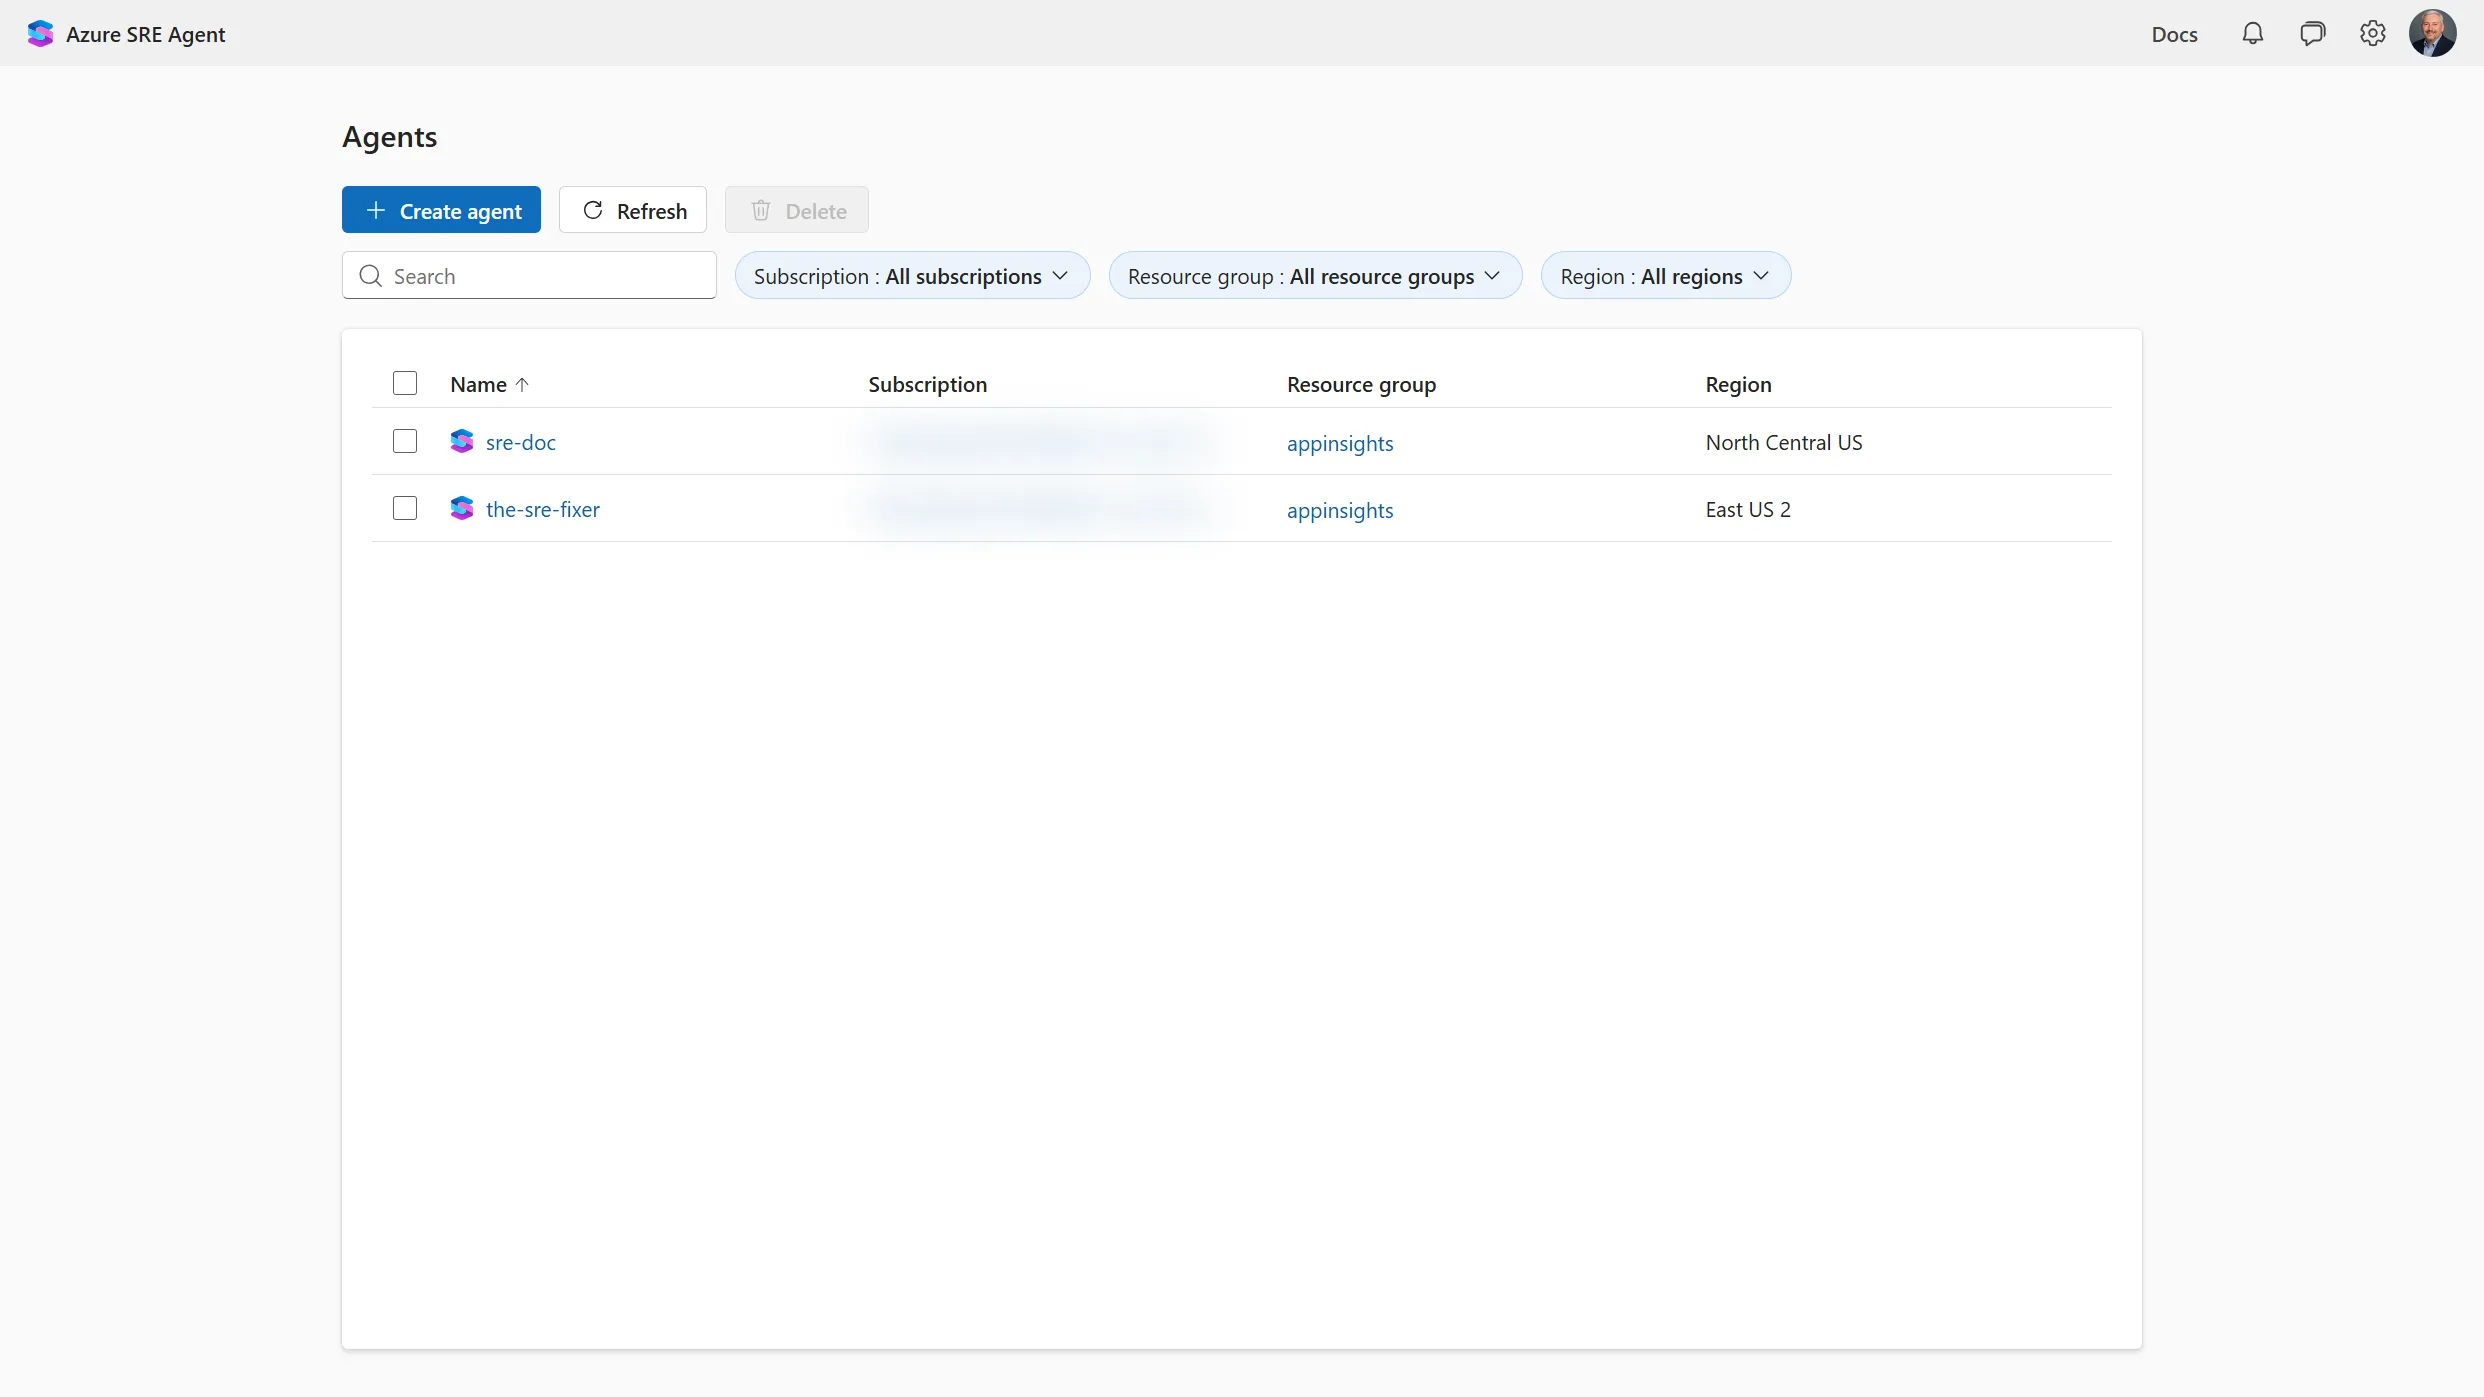
Two regions was accidental. How many agents you run shouldn’t be, and the Zero Ops guide argues for fewer than most teams assume. Every agent carries a baseline charge, so it’s worth right-sizing the count. More importantly, splitting one application across two agents halves what each of them knows, and it’s rarely the half you can spare. The splits the guide says survive scrutiny are narrow: data residency that legally can’t cross a geography, genuinely different access boundaries and blast radius, and one non-production agent to test changes against before they touch prod.
The context argument is the one I’d hold onto. An agent is useful because it holds a whole picture of a system. If your org chart forces a split anyway, plan for those agents to talk to each other, because otherwise every investigation starts with half the evidence and no way to know which half.
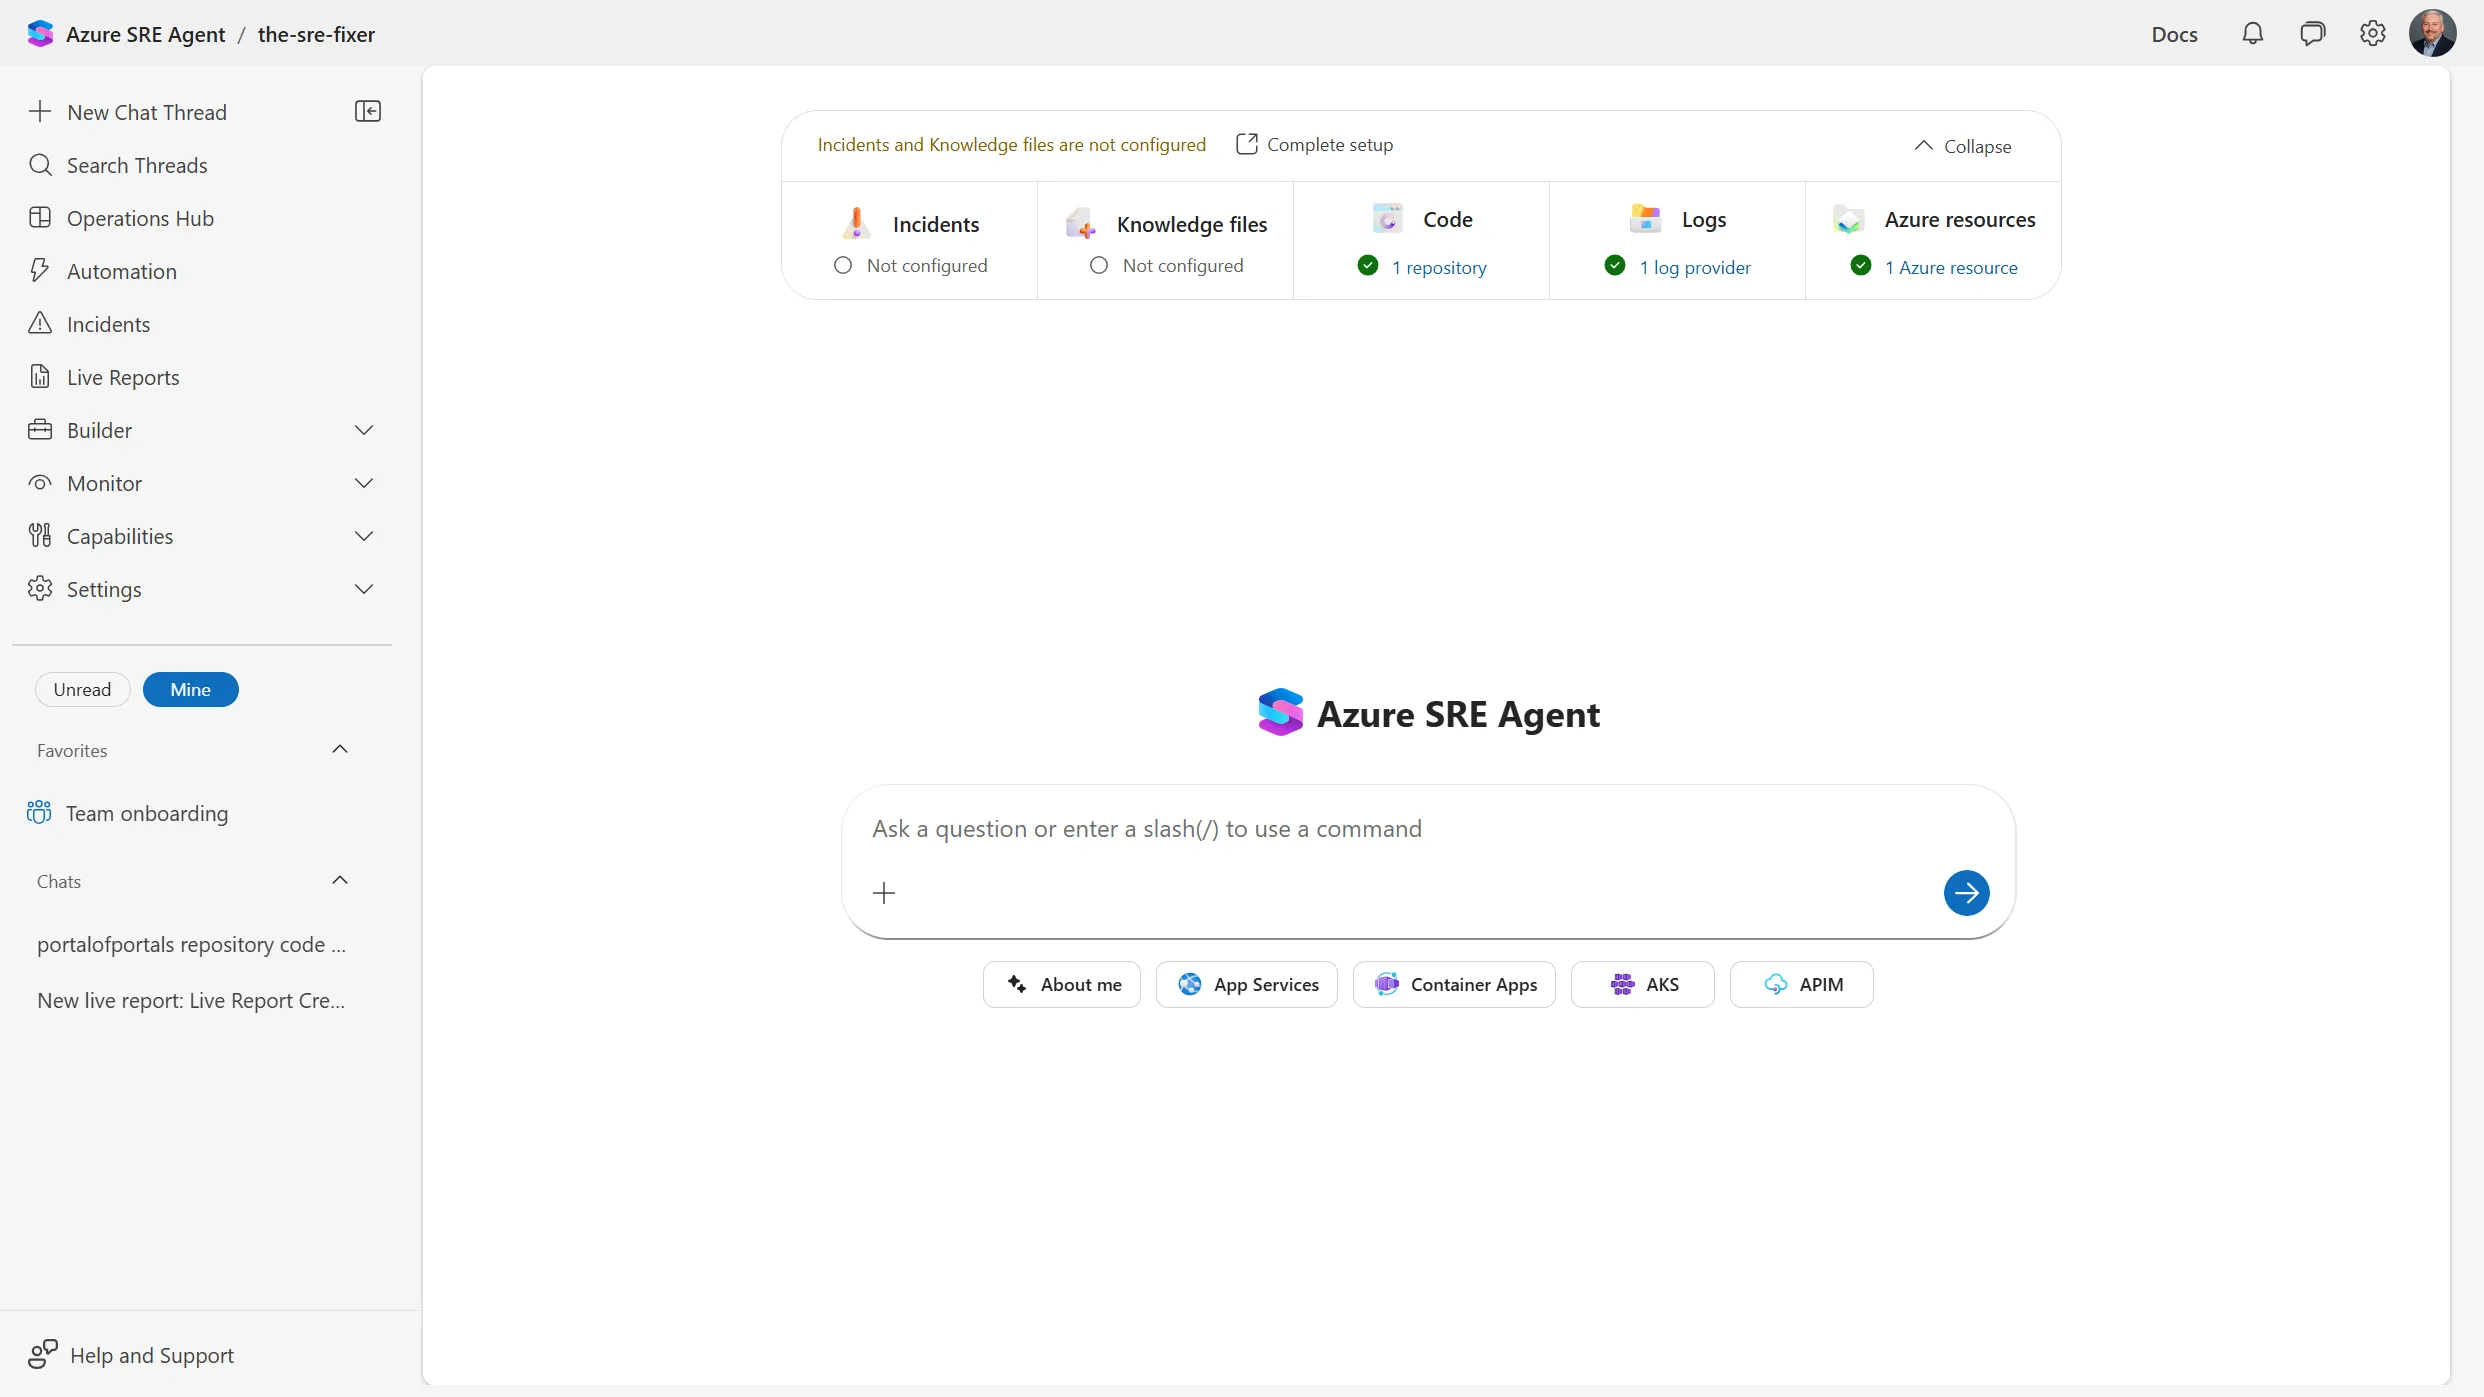
Open a new agent and it tells you what it still needs. The setup strip runs across the top of the chat and tracks five things: Incidents, Knowledge files, Code, Logs, and Azure resources. Green check means connected, hollow circle means the agent is flying without it. You don’t have to finish all five before asking a question. I ran useful investigations with Incidents and Knowledge files still unconfigured. But the strip is honest about what it can’t see yet.
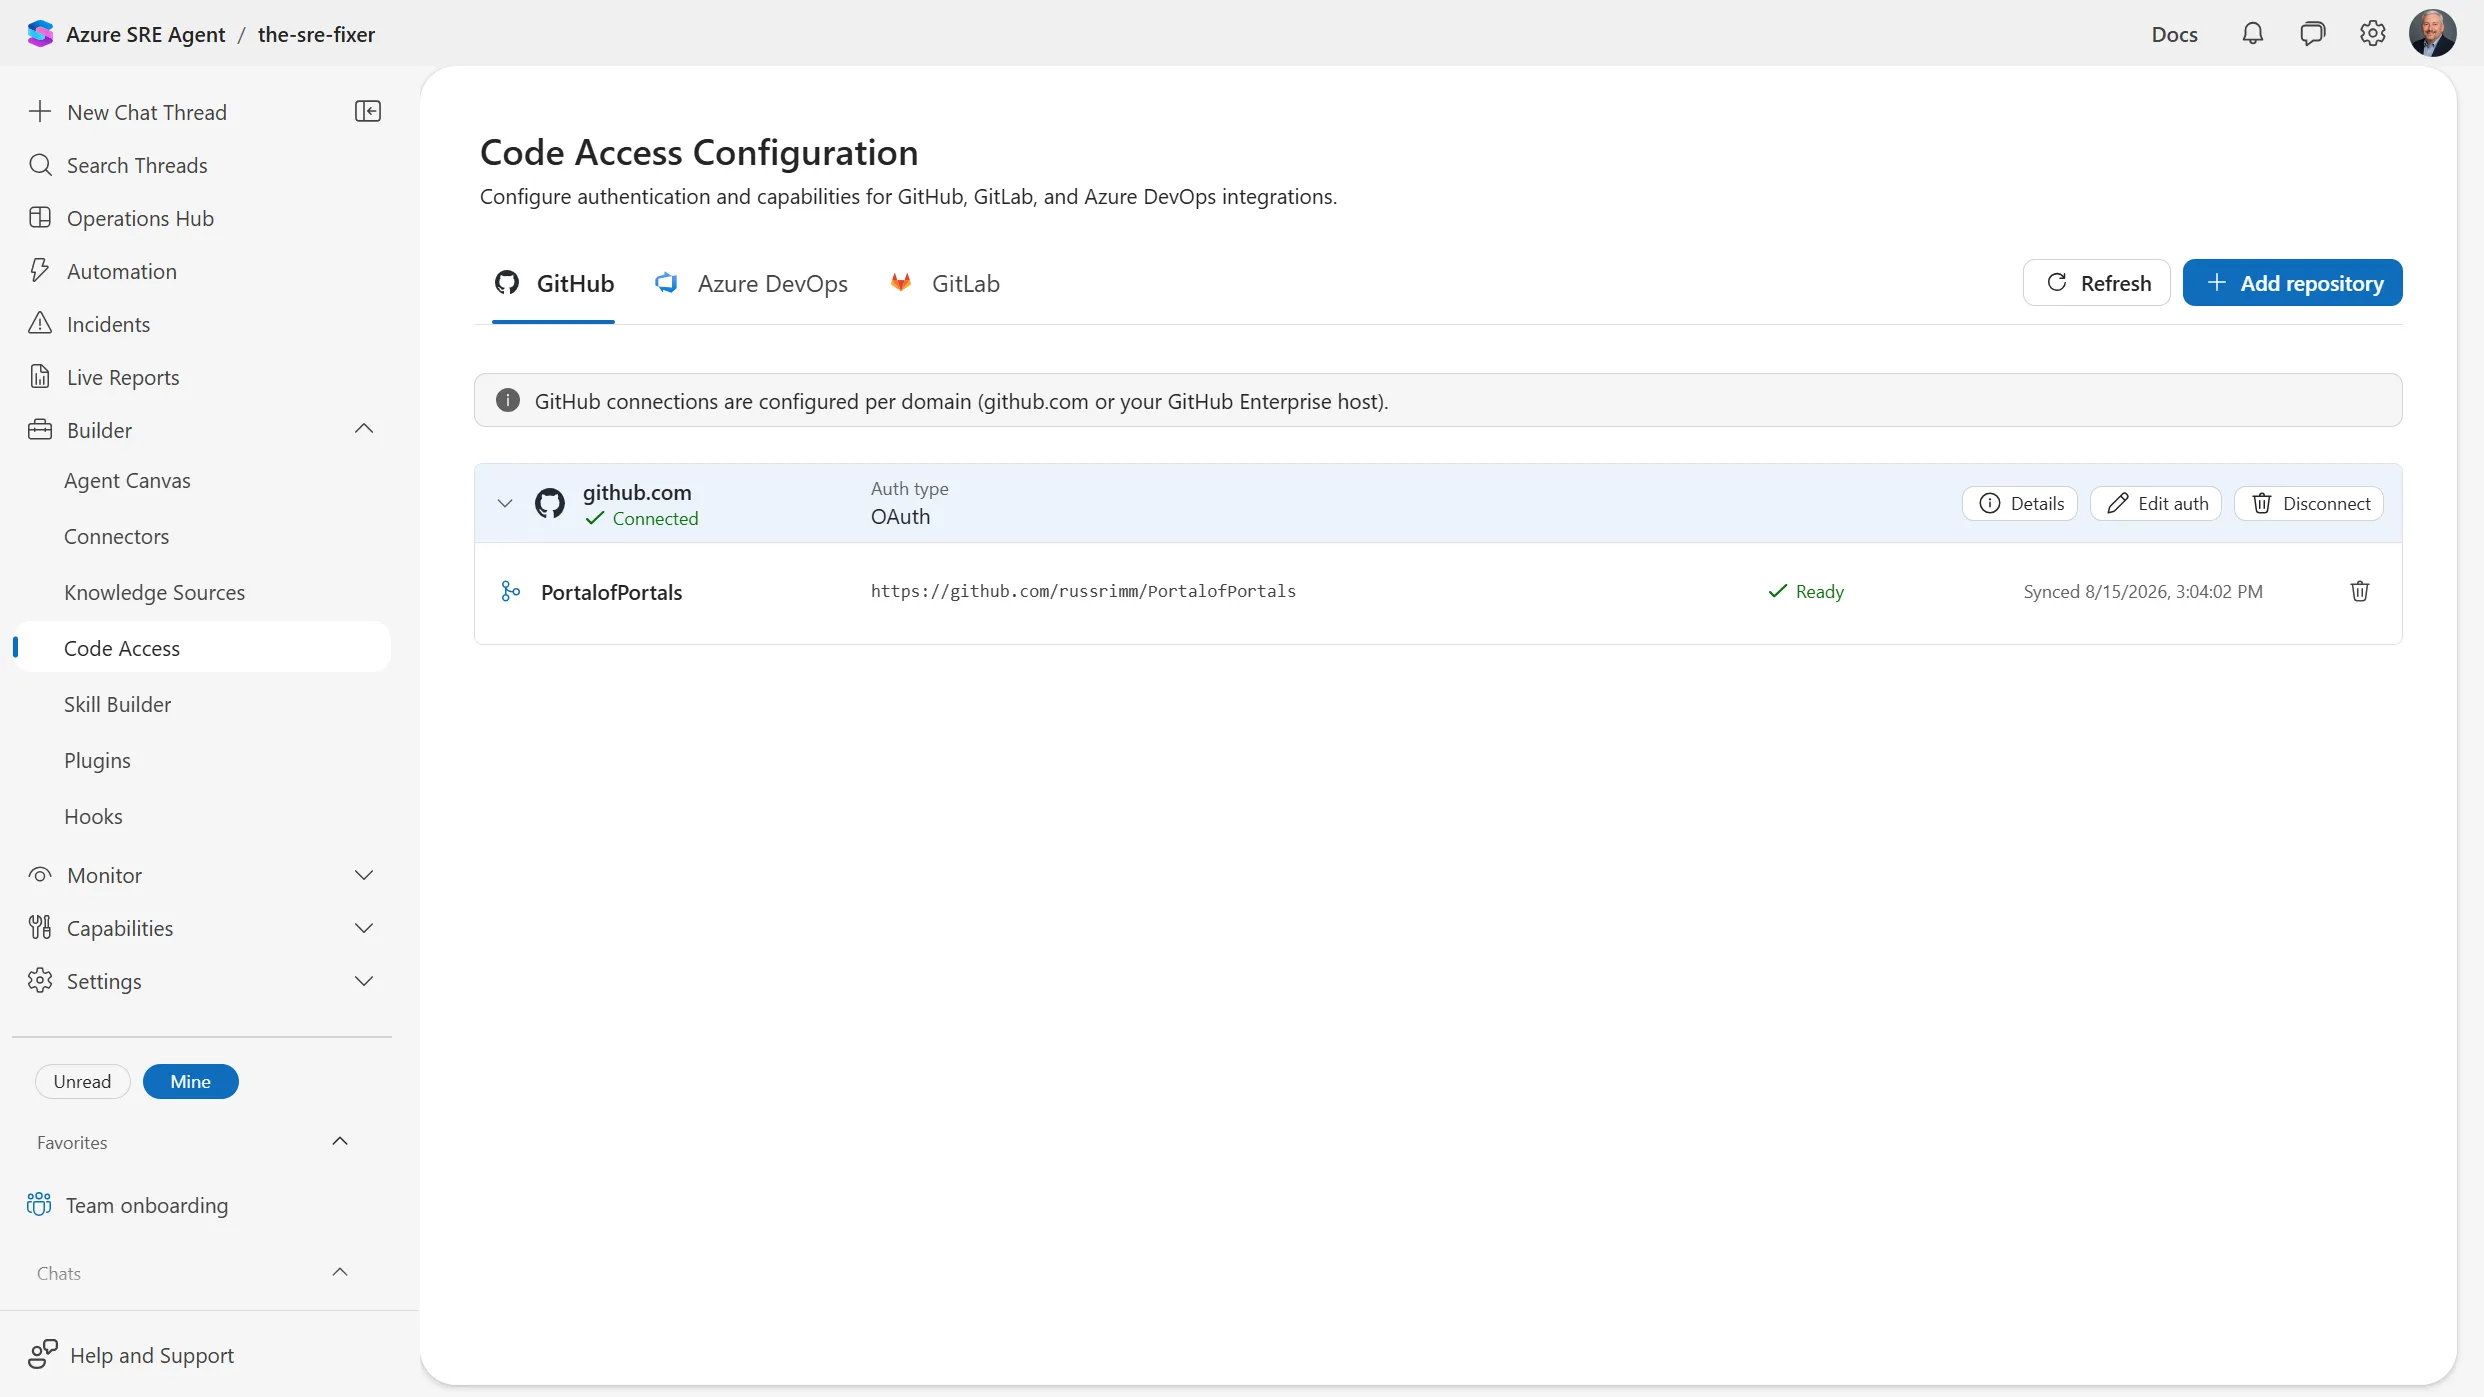
Code Access is where the repo connection lives, and it’s per-domain rather than per-repo: you authorize github.com or your GitHub Enterprise host once, then add repositories under it. GitHub, Azure DevOps, and GitLab each get their own tab. Once a repo syncs, you get a Ready status and a timestamp, so you can tell at a glance whether the agent is reviewing today’s code or a snapshot from last week.
The permissions story goes deeper than the per-connector toggles. The Tools blade lists every built-in tool the agent can call. Fifty of them on my agent, 35 active, and each one has both an on/off switch and an Allow-or-Ask permission. A few are locked on and can’t be disabled. They’re grouped by category, so you can reason about them in batches instead of one at a time: System, DevOps, Workspace Operation, and so on. There are separate tabs for MCP servers, custom tools, advanced permissions, and approval expiration.
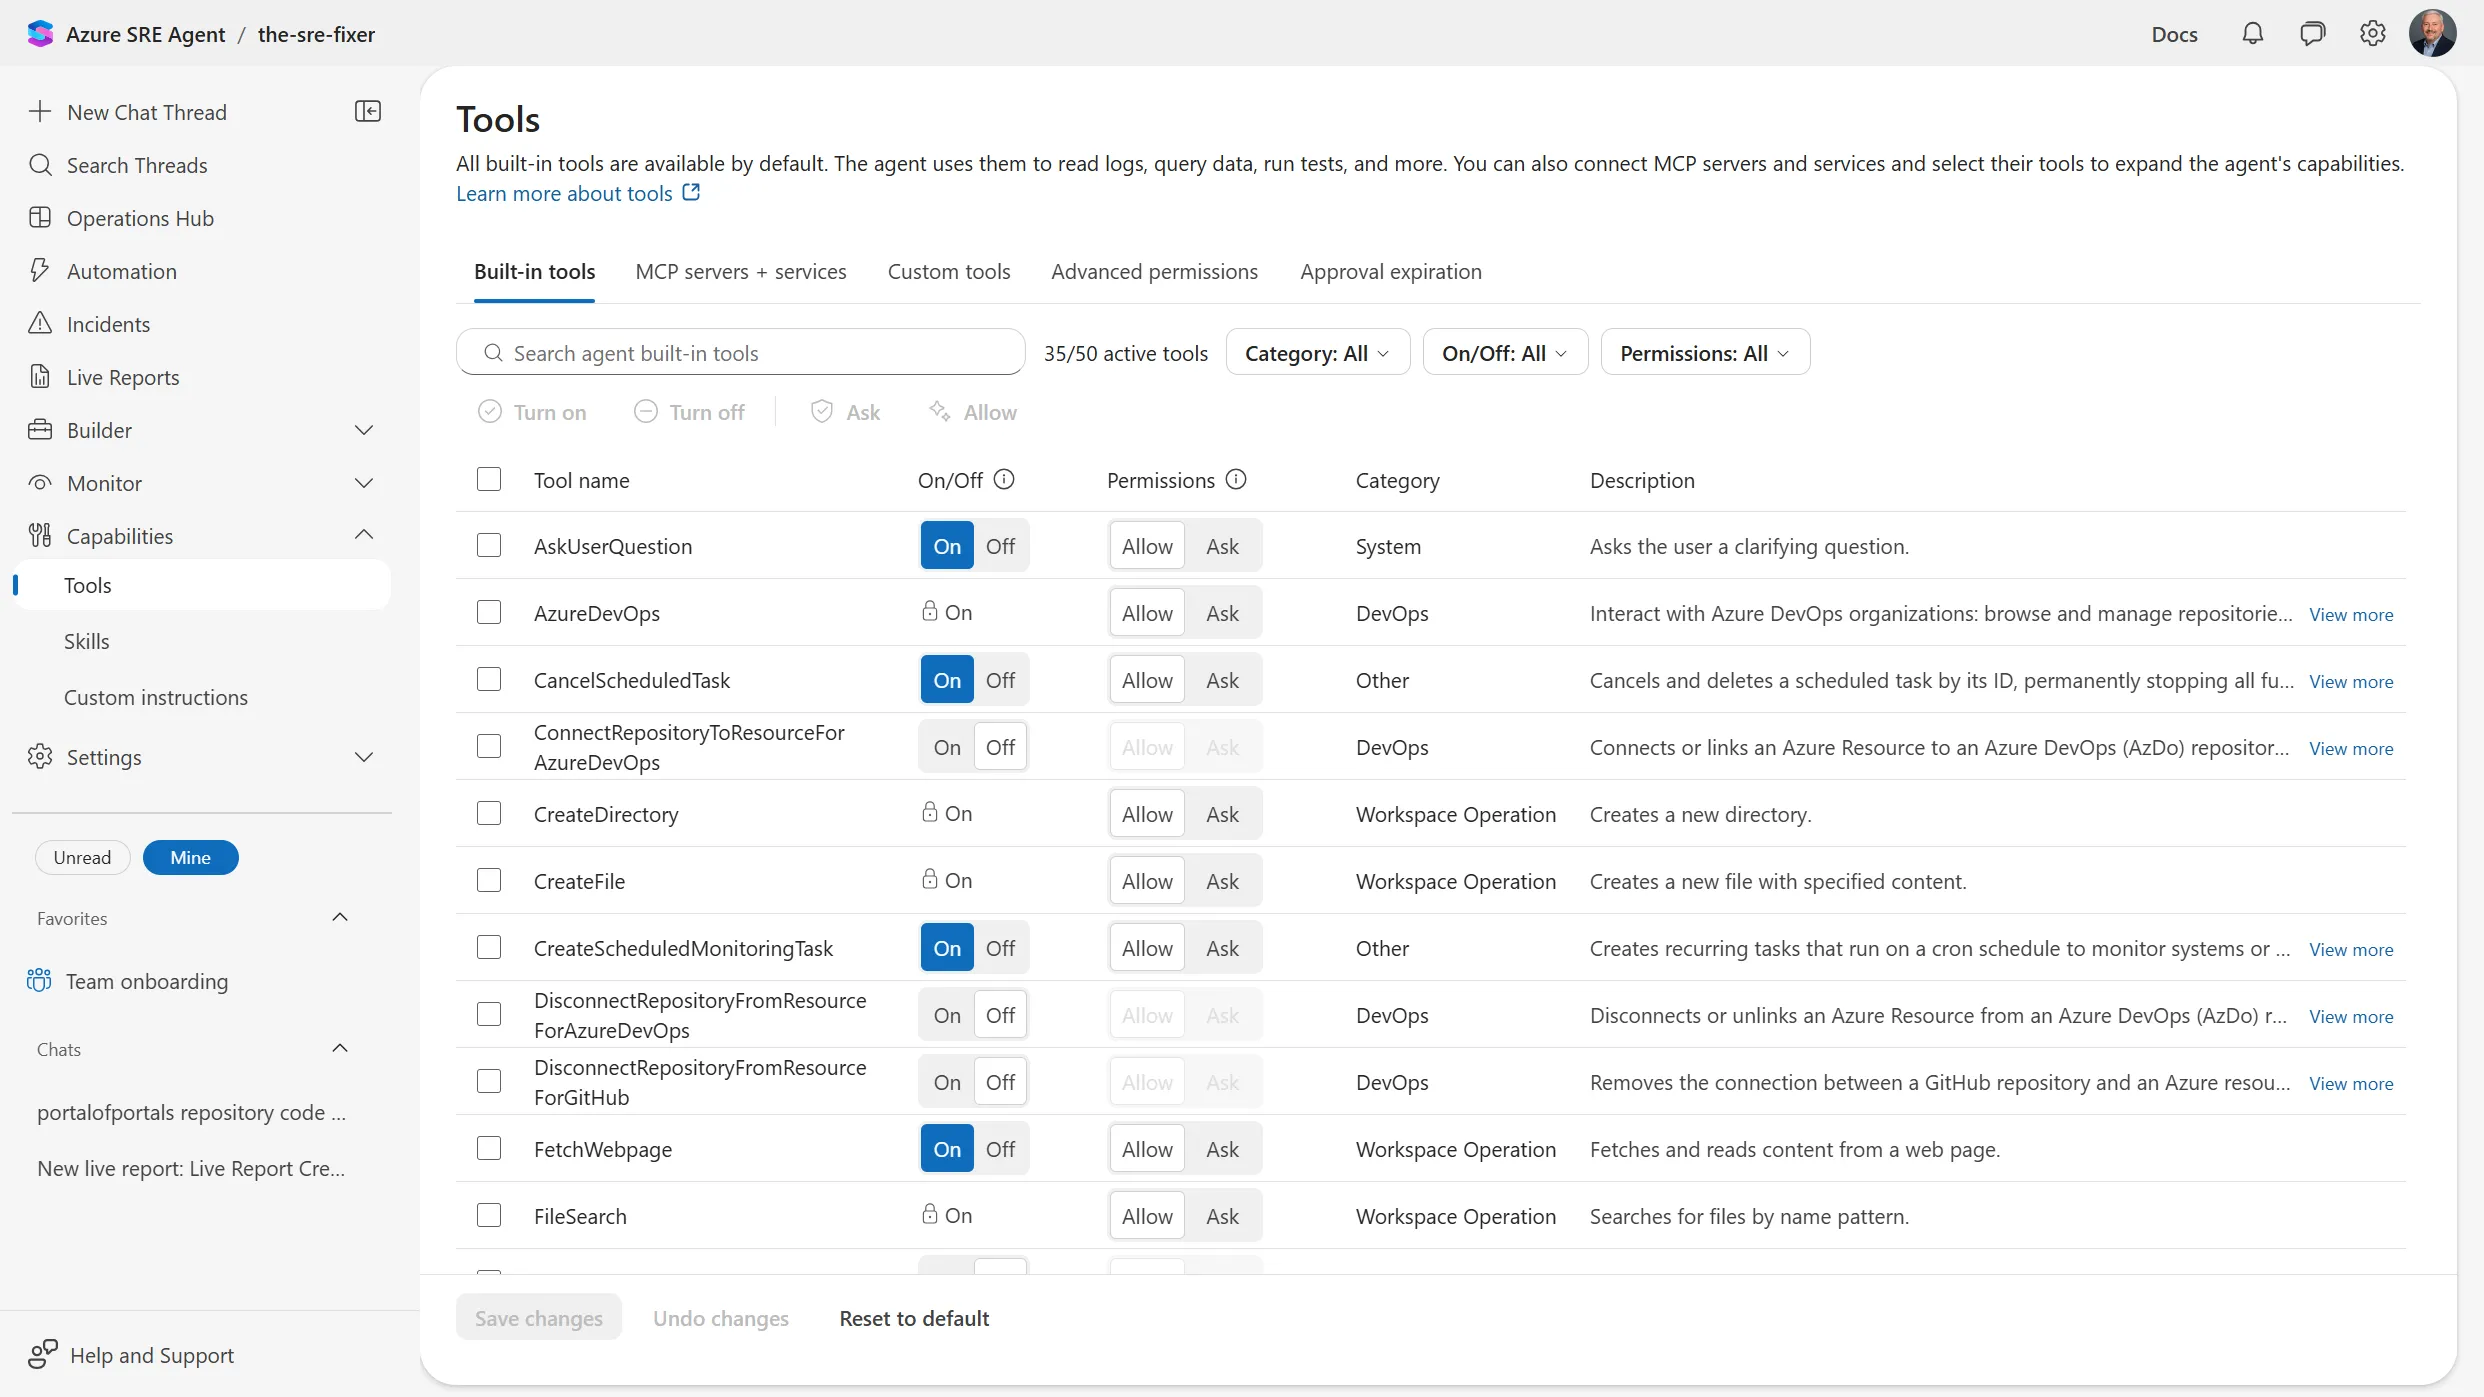
If you’re rolling this out to a team, this page and the connector one are where the actual policy lives. Everything else is configuration; these two decide what the agent is allowed to do when nobody’s watching.
The identity underneath all of it
Both of those pages govern tools. Neither governs Azure. That’s the managed identity, and you pick its shape once, at creation, from two levels. Reader gets core monitoring roles plus resource-type reader roles. Privileged adds resource-type contributor roles based on what it detects in the resource groups you gave it, so a group full of Container Apps gets Container App Contributor. Four roles are assigned either way: Reader, Log Analytics Reader, and Monitoring Reader on each resource group, plus Monitoring Contributor at the subscription so it can acknowledge and close Azure Monitor alerts.
Two details worth having up front. Assign no resource groups at creation and the identity has no permissions at all, so a fresh agent can genuinely do nothing until you say otherwise. And permissions are managed at the resource group level rather than individually, so the resource group is your unit of revocation — worth factoring into how you lay them out.
Reader is the safer default because it fails usefully. When the identity lacks permission for an action, the agent doesn’t skip it quietly. It asks, and an Administrator authorizes that single operation with their own credentials through the on-behalf-of flow. Your credentials aren’t cached, the agent goes back to its managed identity when the operation finishes, and the audit trail records who approved what. Two things to plan around: only Administrators can authorize, and a work or school account has to be available when the agent asks, since personal Microsoft accounts aren’t supported for this flow.
Two governance layers sit above Allow and Ask
I called those pages “where the actual policy lives,” and that was true of the agent I’d built. It isn’t the whole surface. Two more layers sit above per-tool toggles, and the Zero Ops guide is what sent me looking for them.
Tool access policies are pattern rules rather than switches. They live under
Settings > Permissions, they match tool names with * as a wildcard, and
for anything that executes a command they match the arguments too, using
toolGlob(argGlob) syntax. So bash(az * delete *) catches any az ... delete ... regardless of which shell tool runs it, and
RunKubectlReadCommand(kubectl get *) waves reads through while leaving writes
alone. The cap is 1,000 patterns per scope, which is more than anyone needs.
They apply at three scopes, and the asymmetry is the whole design:
- Global, set by an Administrator. Allow, Ask, or Deny, across the agent.
- Custom agent, set by an Administrator or the author. Allow only.
- Thread, set by any user. Allow only, for a single conversation.
Only global can deny. The lower two widen access inside the global boundary but can’t punch through a deny, which is what makes handing an on-call engineer a thread-level override a reasonable thing to do at 3 a.m.
Hooks are the layer that evaluates context instead of matching patterns. You attach a script or an LLM prompt to an agent event and it returns JSON saying allow or block. Command hooks run bash or Python in a sandbox for deterministic checks, capped at 64 KB and a 300-second timeout. Prompt hooks put a model in the loop for judgment calls, defaulting to a Fast Reasoning tier because they fire on every response or tool call and latency compounds fast. Agent-wide hooks are configured under Builder > Hooks, per-custom-agent ones from the Agent Canvas, and when both match the same event both run, agent level first.
Three things to verify against the current docs
Three things I’d check before designing around them.
The guide describes four hook events: Start, PreToolUse, PostToolUse, and Stop.
The hooks documentation
says two are supported today, Stop and PostToolUse. Worth knowing which two,
because PostToolUse fires after the tool has run. The guide’s worked example,
allowing DROP INDEX while blocking DROP TABLE by inspecting the SQL before
it runs, is written for PreToolUse. With today’s events you’d express that as a
global deny policy on the pattern and let the hook audit the result afterward.
Same outcome, different mechanism, so build it with the policy doing the
blocking.
The guide also says a global deny can’t be overridden by a lower scope, so an admin can set a floor and know it holds. That’s how the policy scopes work. The tool access policy docs add one more piece to the picture: hooks sit at the highest priority, and a user-defined hook returning allow takes precedence over policy rules, global deny included. Only Administrators can create hooks and every override is audit-logged, so it stays governed and visible. Just build the mental model as “the floor is the deny list plus whoever can write hooks.”
Third, roles. The guide lists four: Administrator, Author, Standard User, and Reader. The user roles page documents three today, and the plugin marketplace docs name SRE Agent Author as a prerequisite in several places. Author is real, and it’s the role I mentioned earlier that can install from any registered marketplace. Look for it in the marketplace docs rather than the roles page.
One more detail, this one straight out of the hooks reference. A Stop hook that
rejects without a reason field is treated as approval. Include that field
and your validation gate behaves the way you expect.
Where its traffic can actually go
Those two pages decide what the agent can do. Neither of them decides where its traffic ends up. By default the answer is “anywhere on the public internet,” which is fine for a test agent and a real problem for one you’ve just handed read access across production.
VNet integration landed in preview in June, and it’s the piece I’d read before putting this anywhere sensitive. The argument for it is one your security team already makes about every other workload: a component’s network access shouldn’t depend on the component behaving correctly. The agent reads logs, code, and configuration by design, so open egress gives that data a route out. It also reasons over text it didn’t write, which is the textbook prompt injection surface. A boundary enforced in the network holds whether or not the model spots the trick.
You pick from three egress modes under Settings > Workspace configuration > Networking:
- Unrestricted. The default. Any endpoint, no restrictions.
- Limited. Deny all, allow an explicit list of hosts. Host-level control without standing up a VNet.
- Azure VNet. Non-platform outbound traffic routes through a delegated subnet in your network, with your NSG rules, firewall policies, custom DNS, and network logging applied to it.
In Azure VNet mode the agent is just another workload on that subnet. It reaches what the subnet can reach and nothing else: databases behind private endpoints, internal services, a Log Analytics workspace with public access disabled, anything on-premises you’ve connected over ExpressRoute or VPN. During a real incident most of what you want the agent reading is private anyway, so this constrains less than it sounds like it would.
The subnet has a few requirements
The subnet has to be dedicated, sit in the same region as the agent, and be
delegated to Microsoft.App/environments — the Container Apps delegation,
which is not the one you’d guess. You need Network Contributor on the subnet
(or any role carrying Microsoft.Network/virtualNetworks/subnets/join/action)
plus SRE Agent Administrator on the agent resource.
On size, the docs say /28 or larger and suggest /26 for a fleet, and the announcement post mentions /27. A /27 covers all of that with room to grow.
Two behaviors worth knowing before you commit: once a VNet is connected, the Unrestricted and Limited cards grey out, so changing modes means disconnecting first. Changing the subnet means disconnect and reconnect too.
Link the private DNS zones, or you’ll debug this at the wrong layer
Connecting a VNet enables “Use VNet’s private DNS” automatically, but that only
does something if the relevant Azure Private DNS zones are actually linked to
the VNet: privatelink.ods.opinsights.azure.com for Log Analytics,
privatelink.vaultcore.azure.net for Key Vault, and so on for anything else
behind a private endpoint. Skip that step and the agent either falls back to
public endpoints or fails to connect.
That matters more than usual because of how the agent reports failures. When the network blocks a call, it gets the same error any workload on that subnet would get, notes it in the investigation output, and carries on with whatever it can still reach. Correct behavior, but it means an investigation can come back confident and incomplete at the same time. Read the failures, not just the findings.
The bypass toggles are the part to govern
Some traffic never touches your VNet regardless. Platform services — orchestration, model endpoints, telemetry — always route through Microsoft’s managed infrastructure and aren’t configurable.
Below that sits an “On the infra network” section with toggles for package registries (PyPI, npm, NuGet, apt), code repositories (GitHub, GitHub Enterprise, Azure DevOps), remote MCP servers, and a free-form list of extra hostnames. Anything switched on there skips your VNet entirely, so your NSG rules and firewall policy never see it.
The reason they exist is practical rather than lazy. None of those services map to an Azure service tag, and they run on large, frequently changing IP ranges. If your firewall filters by IP, maintaining that list is a standing chore, and the day it falls behind an investigation stalls on a package download instead of the incident. The toggles are framed as transitional: the destination is FQDN-based egress filtering in your network, at which point you move those categories back through the VNet.
Two things narrow the gap in the meantime. The Packages tab lets you preinstall pip and .NET CLI tool packages into the sandbox image, which removes a reason to leave the registry toggle on at all. And you can apply Azure Policy to restrict or disable the toggles, so no operator can quietly widen the agent’s reach.
What the preview covers today
Two boundaries to plan around, and the second one is easy to miss. It’s egress only, so reaching the agent privately from inside your network is outside this preview. And connector traffic routes separately from the VNet. That Teams connector with 71 tools goes over the public internet whether or not you’re in Azure VNet mode, and the same is true of anything else you wire in through Connectors. Plan your egress story with connectors accounted for separately.
The code review went further than I expected
I pointed the CodeReview subagent at one of my project repos expecting the usual: dependency CVEs, a couple of hardcoded secrets I’d meant to rotate out, maybe an injection risk in a query I’d written too quickly. I got that. What I didn’t expect was the rest of the list.
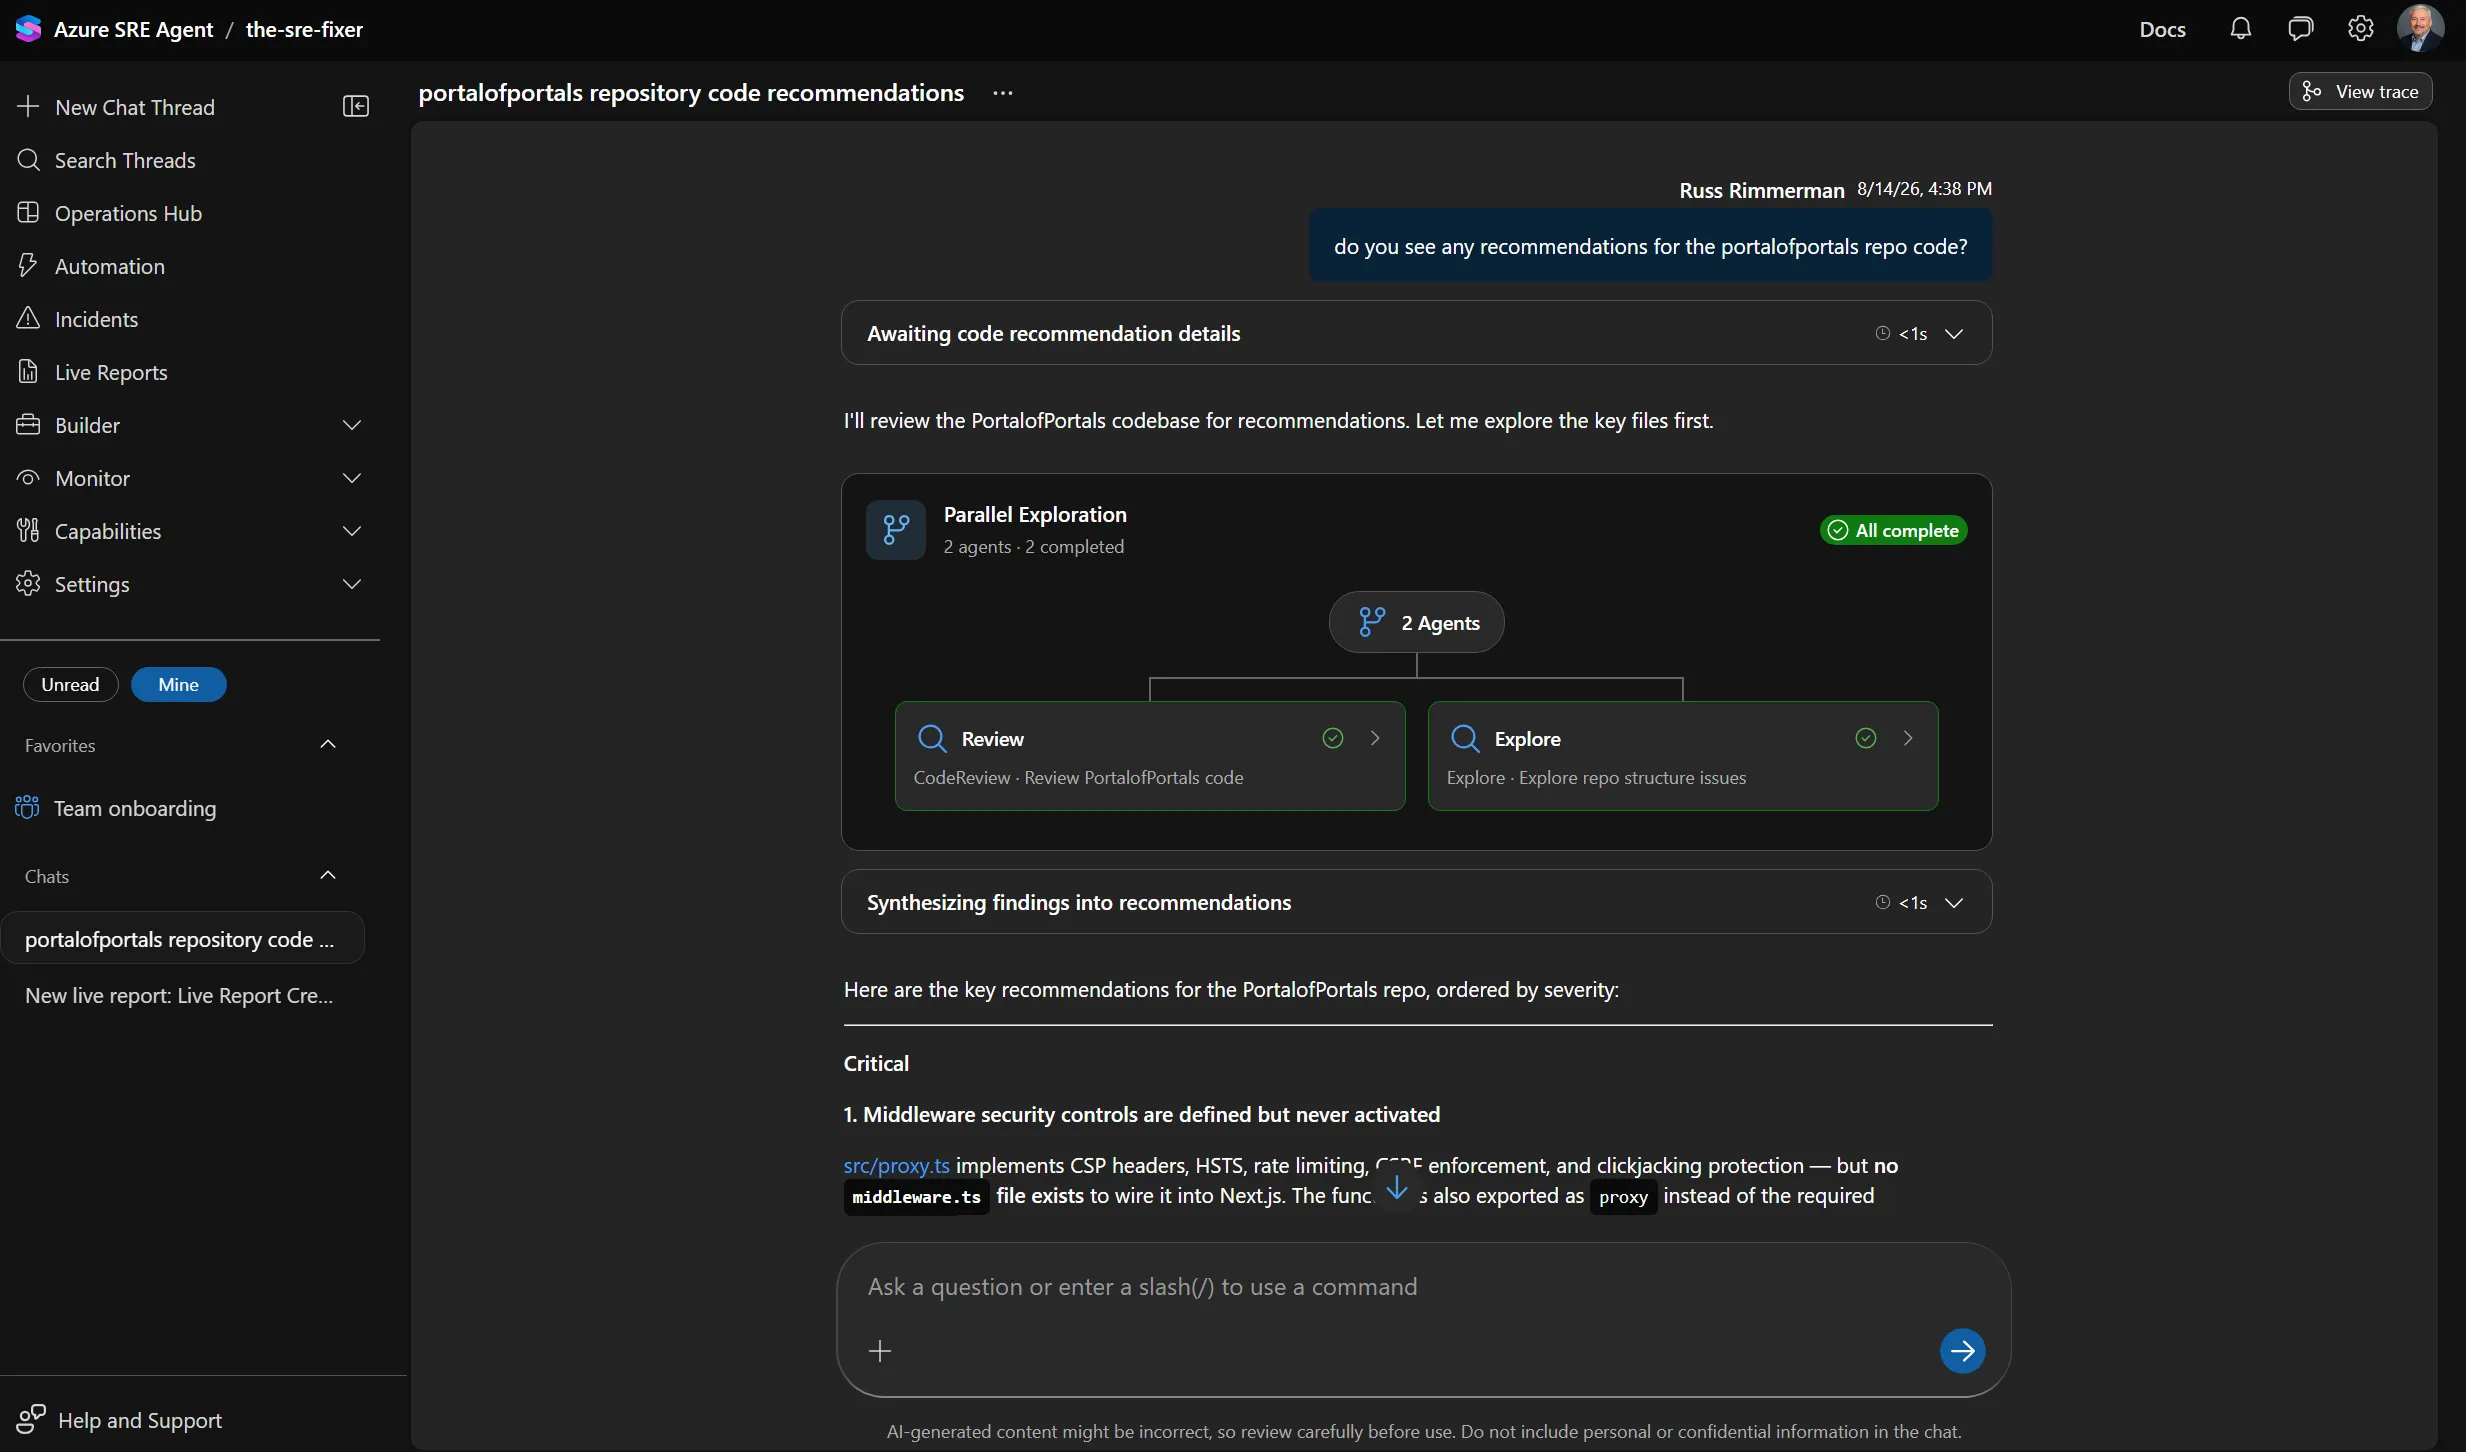
Before it answered, it fanned out. A CodeReview subagent took the security and convention pass while an Explore subagent mapped the repo structure, both running at once, both reporting back before the agent synthesized anything. That structure is visible in the thread rather than hidden behind a spinner, which matters when you want to know whether a finding came from reading the code or from guessing at it.
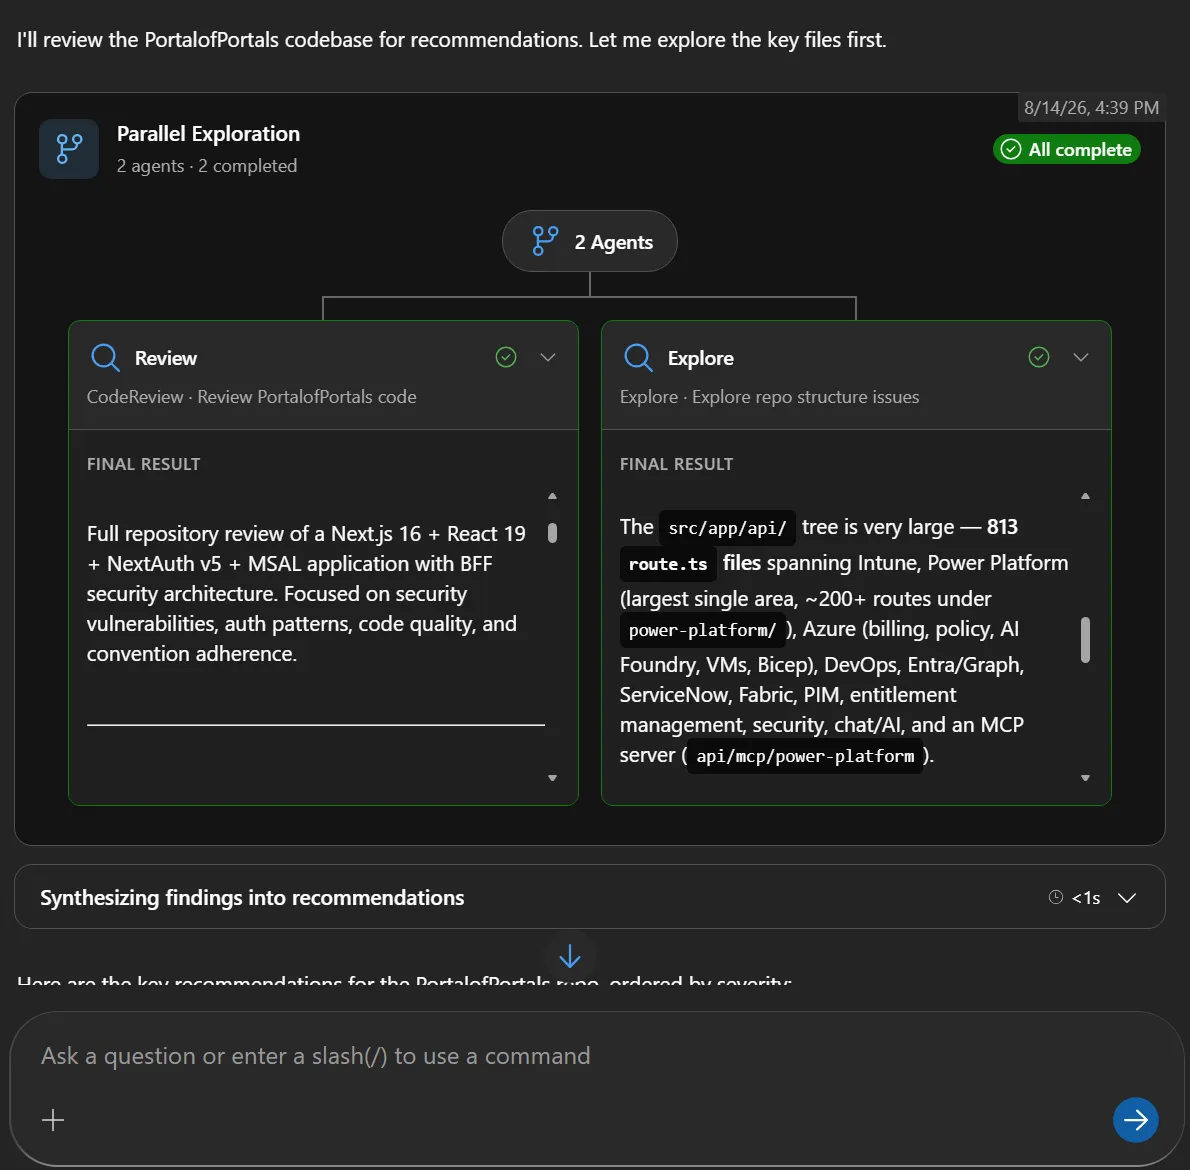
It flagged a performance issue in how I was paginating a large result set, an accessibility gap where a custom form control had no accessible label, and a UX inconsistency between two error messages that told users two different things for the same failure. None of that is exotic advice on its own — any good reviewer would catch it. What stood out was getting security, performance, accessibility, and UX findings back in the same pass, against my own code, in minutes instead of a scheduled review cycle.
The findings came back ordered by severity, each one pointing at the specific
file and line rather than describing the problem in the abstract. A pre-release
next-auth sitting under 800-plus API routes, unguarded console.log calls
leaking partial API keys and decoded token claims into production logs,
hardcoded hex colors in six chart components that bypassed the theme tokens
already defined in globals.css. Every one of those was checkable in under a
minute because it told me where to look.
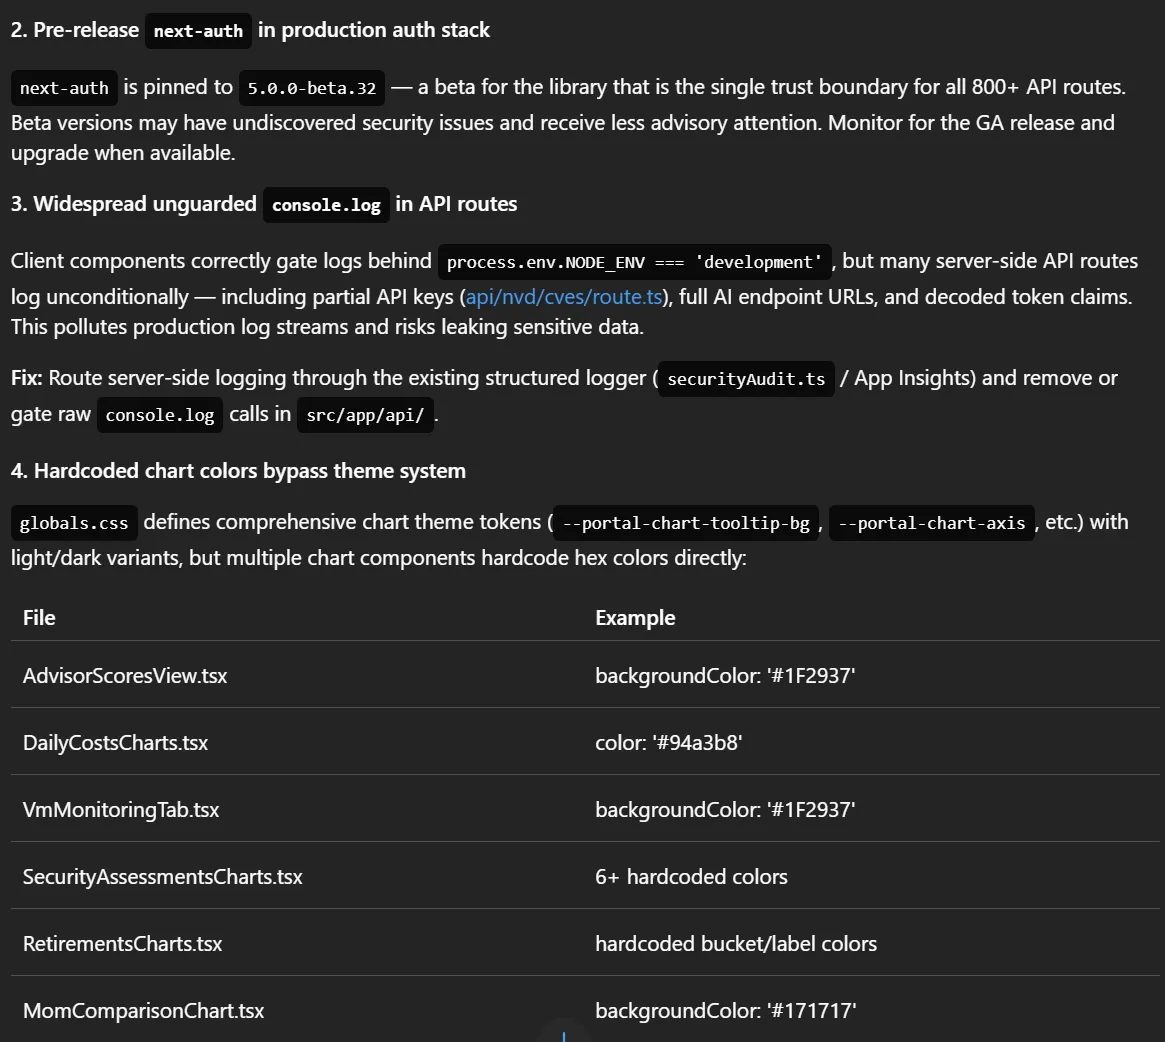
If you run a solo shop or a small team without a dedicated accessibility or performance reviewer, that’s the gap this fills. Not a replacement for a real code review culture, but a much earlier catch than “we’ll get to it before launch.”
Then it checked what my telemetry was actually saying
The second half of the hour was the one that changed how I think about this tool. I have Application Insights wired up across several different pieces of my environment: Dataverse, a Copilot Studio agent, a couple of app servers, and a Foundry-hosted agent. Each of those emits its own telemetry, and normally checking all of it means opening separate blades, running separate KQL queries, and manually correlating anything that looks off.
Once Azure SRE Agent had read access to those Application Insights resources, it queried requests, dependencies, and exceptions across all of them and called out the unhealthy signals directly: a latency trend on one app server that had been quietly climbing, an elevated exception rate coming out of the Copilot Studio agent, and a dependency call from the Foundry agent that was failing more often than it should. It correlated pieces of that with recent changes and proposed what to look at first, rather than handing me four dashboards and telling me to figure it out myself.
That’s the difference between monitoring and triage. Monitoring tells you something is happening. Triage tells you what to do about it, and where to start.
One prompt, one health check
Since writing the first version of this post I went back and gave the agent a deliberately lazy prompt, the kind you’d actually type at 2 a.m.: give me a health check across everything you’re connected to, list the Azure resources you manage, query Application Insights for the last 24 hours, and tell me what looks unhealthy and what you’d investigate first.
It took 147 seconds. The interesting part is what it showed while it worked.
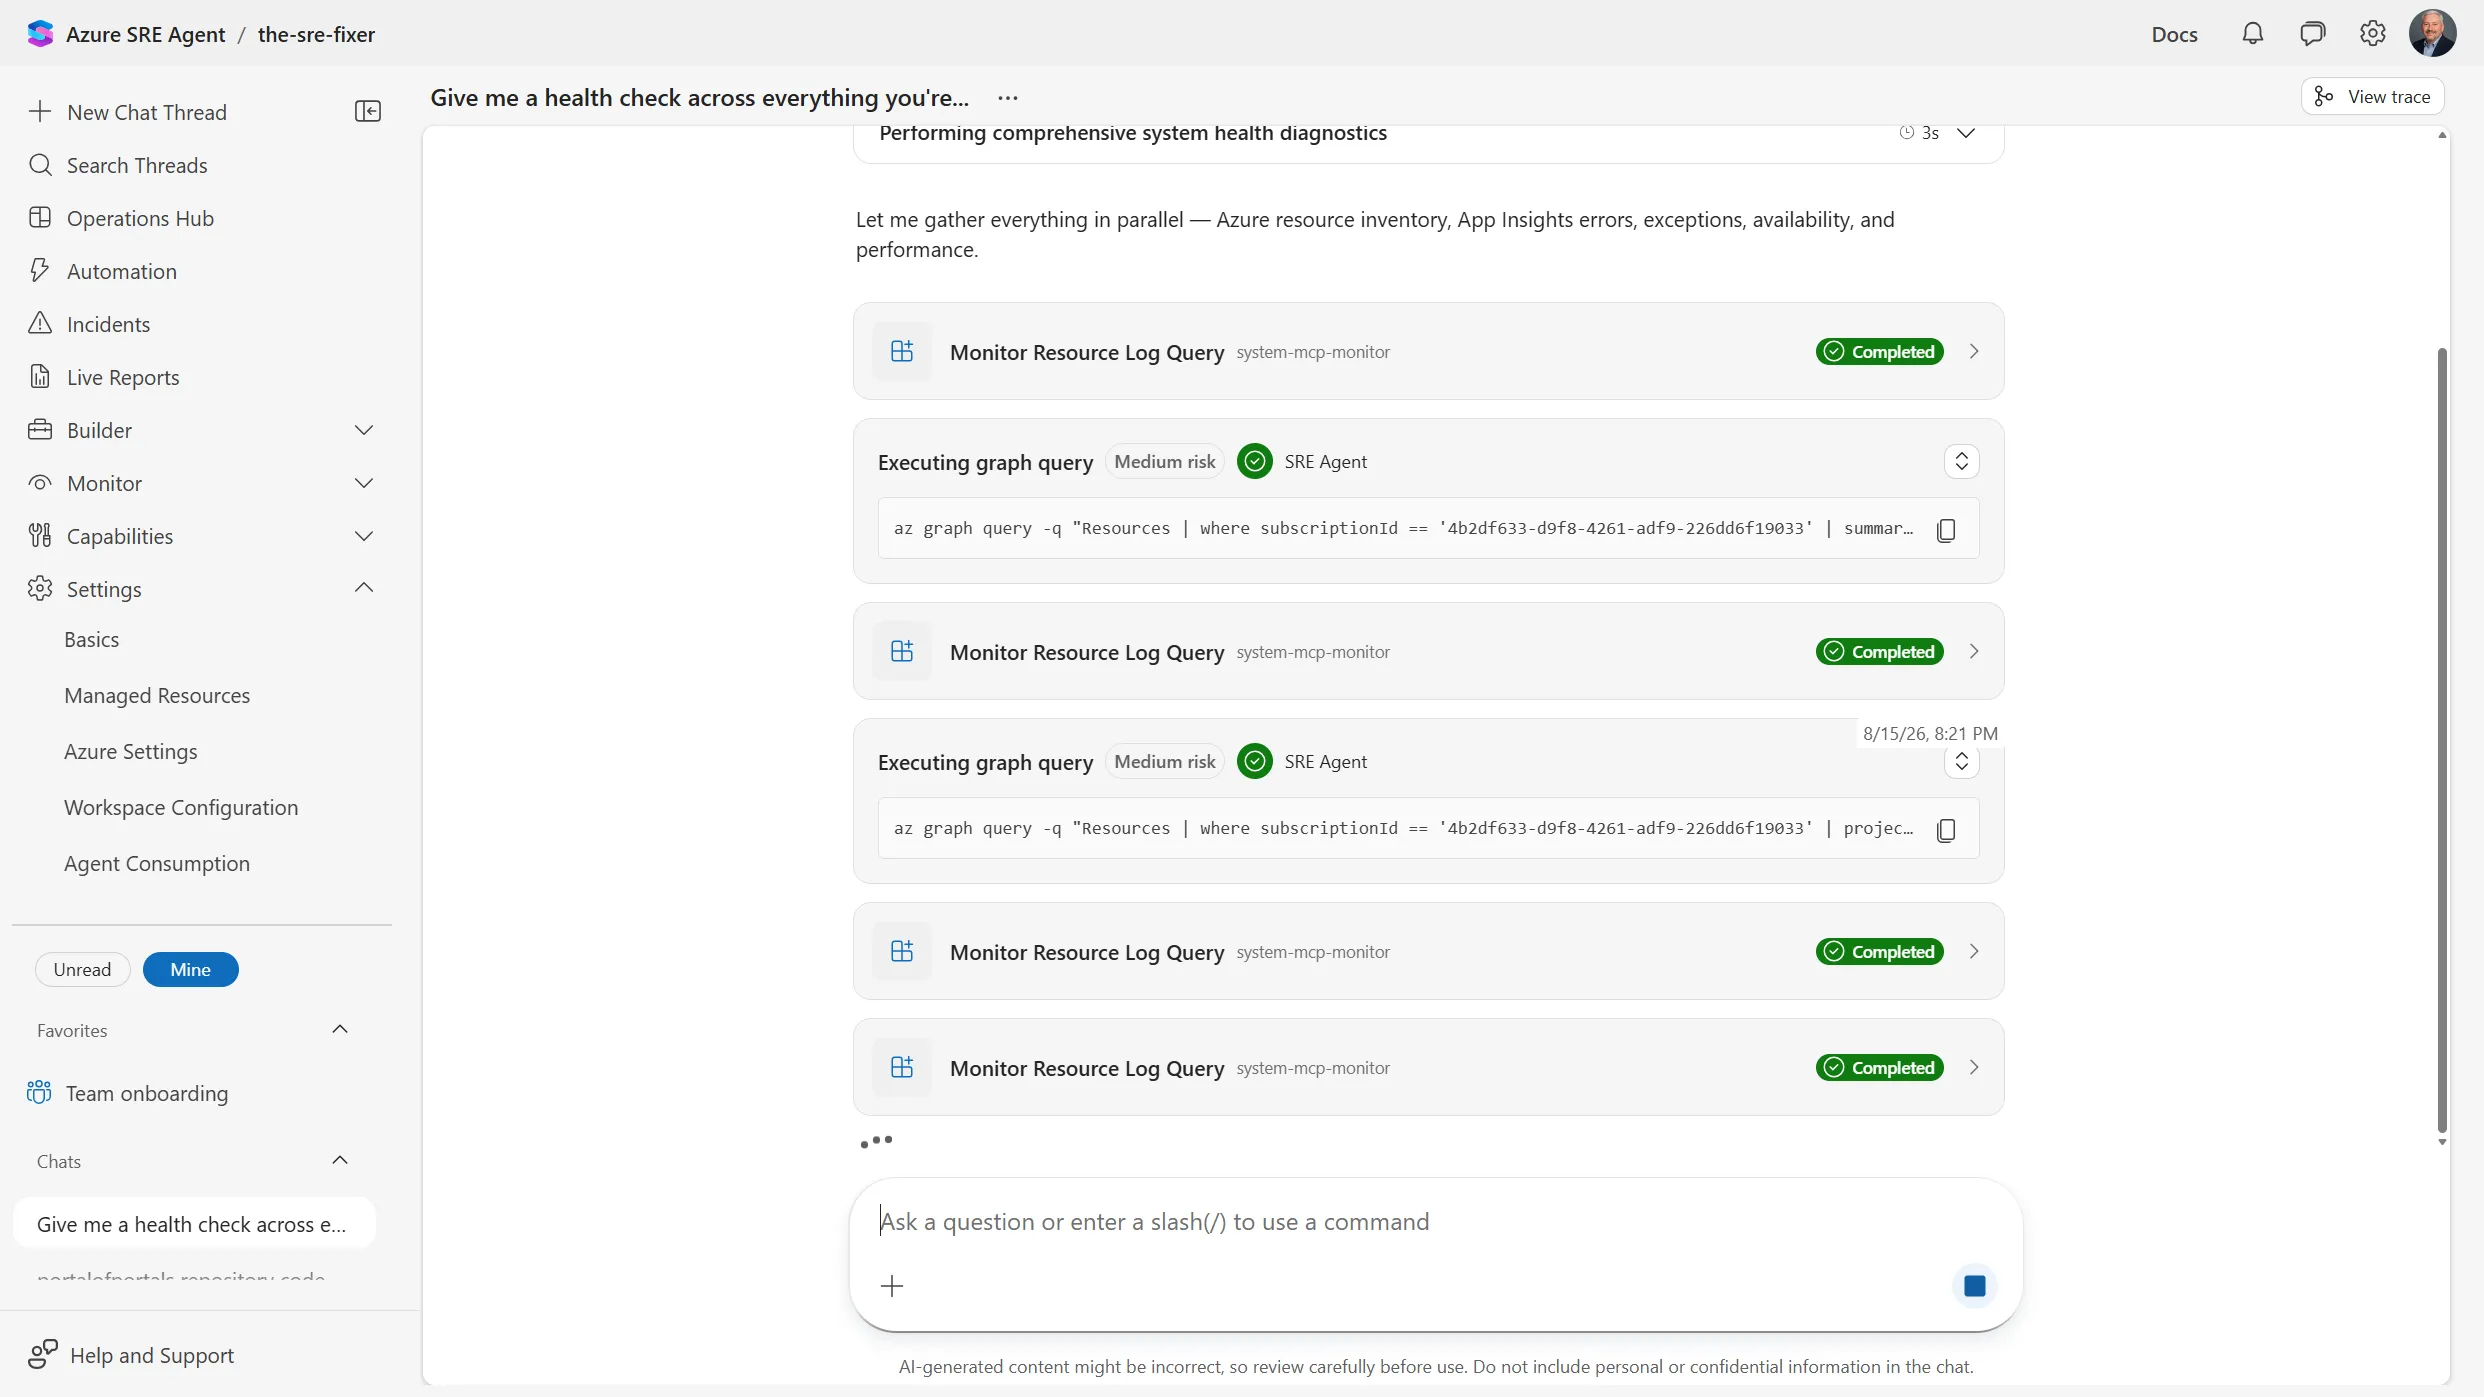
It announced it was gathering everything in parallel, then ran the actual
commands in the open: az graph query calls against Resource Graph, KQL
against the requests, exceptions, and dependencies tables in Application
Insights, with each one labeled and each one marked complete as it landed.
The Resource Graph calls carried a Medium risk tag. You can read the
exact query it ran and copy it out.
The answer opened with an inventory, then a section headed “What’s Unhealthy / Noteworthy.” All 13 VMs deallocated, including a 10-node compute fleet. Seven of ten web apps stopped, two of which still had failure-anomaly alert rules pointed at them, which, as it noted, is an odd combination if they’re meant to be off.
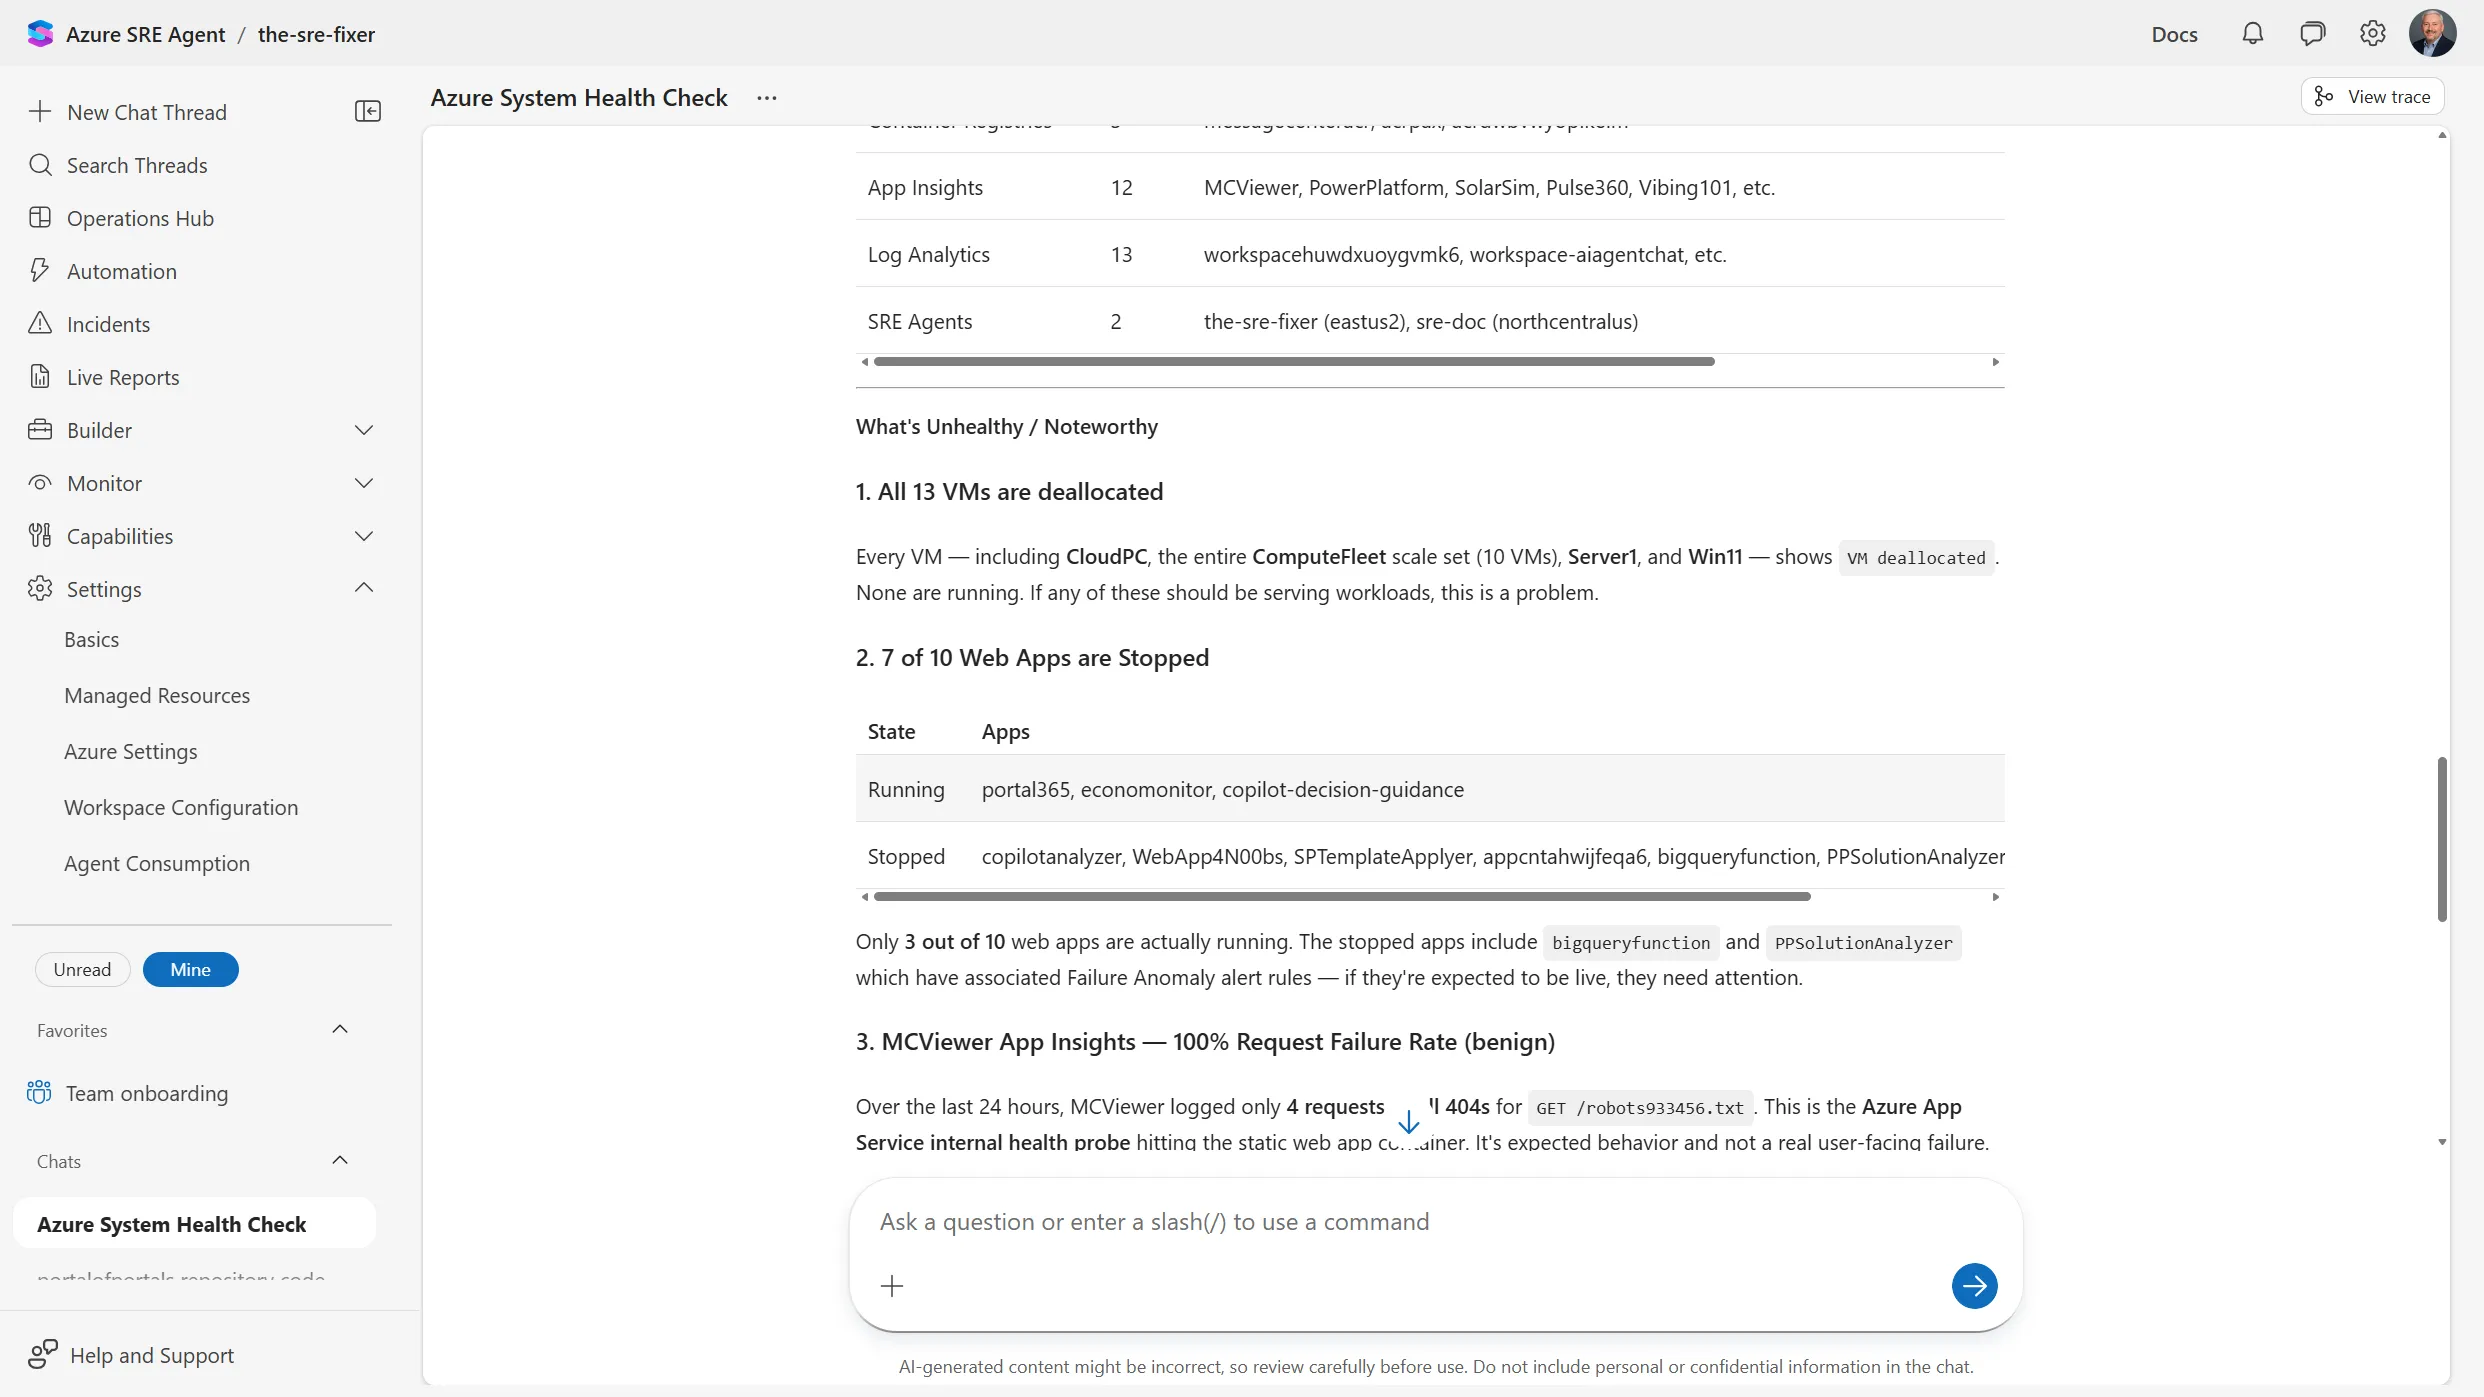
The finding I keep coming back to is the third one. One Application Insights
resource showed a 100 percent request failure rate over 24 hours, which
looks alarming until you read the next line: four requests, all 404s, all
for GET /robots933456.txt. That’s the App Service internal health probe
hitting a container. The agent labeled it benign, explained why, and then
made the point that actually mattered: near-zero real traffic means either
nobody is using the app or the SDK isn’t wired up correctly.
A dashboard would have drawn that as a red 100 percent and left me to work out the rest. Catching a false positive and then finding the real problem hiding behind it is the part that’s hard to automate, and it’s the part it did well.
It closed with a priority table, P1 through P4, each row carrying a reason rather than just a severity, and a separate list of what looked healthy so I wasn’t left guessing about the things it didn’t mention.
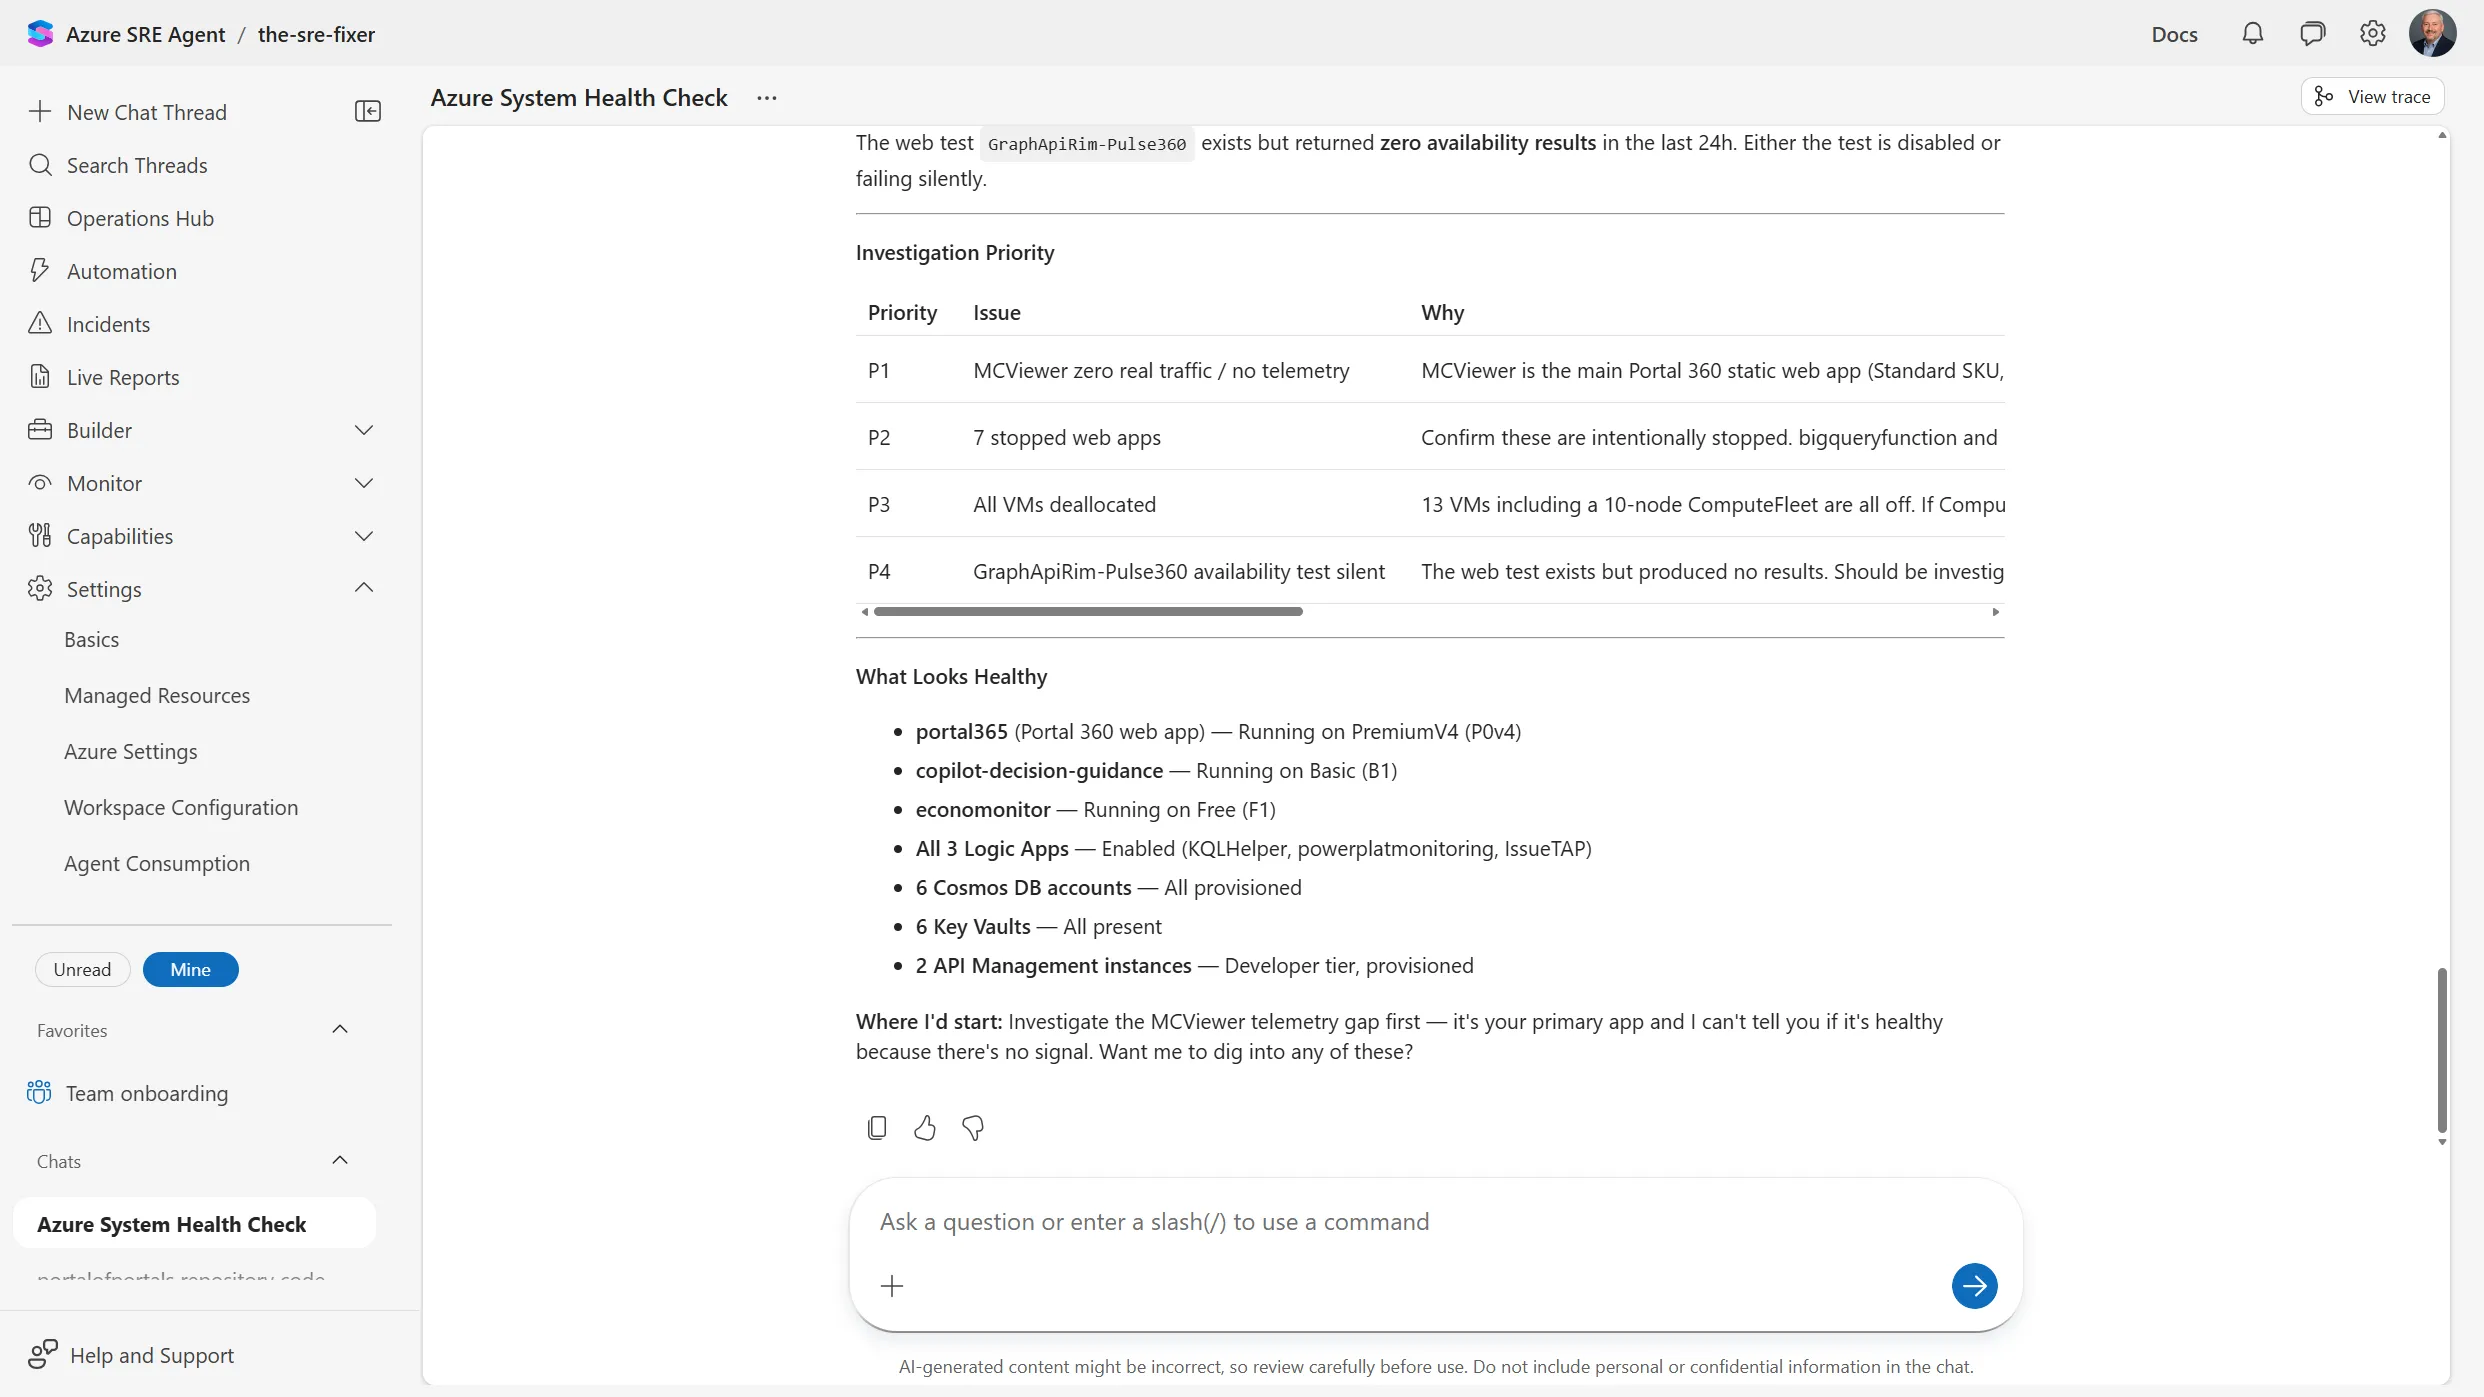
Its closing line was the right one: investigate the telemetry gap first, because it couldn’t tell me whether my main app was healthy when there was no signal coming out of it. That’s a better answer than a fake all-clear.
The parts I didn’t expect to use
A few blades I ignored on the first pass turned out to be the ones I’d actually keep.
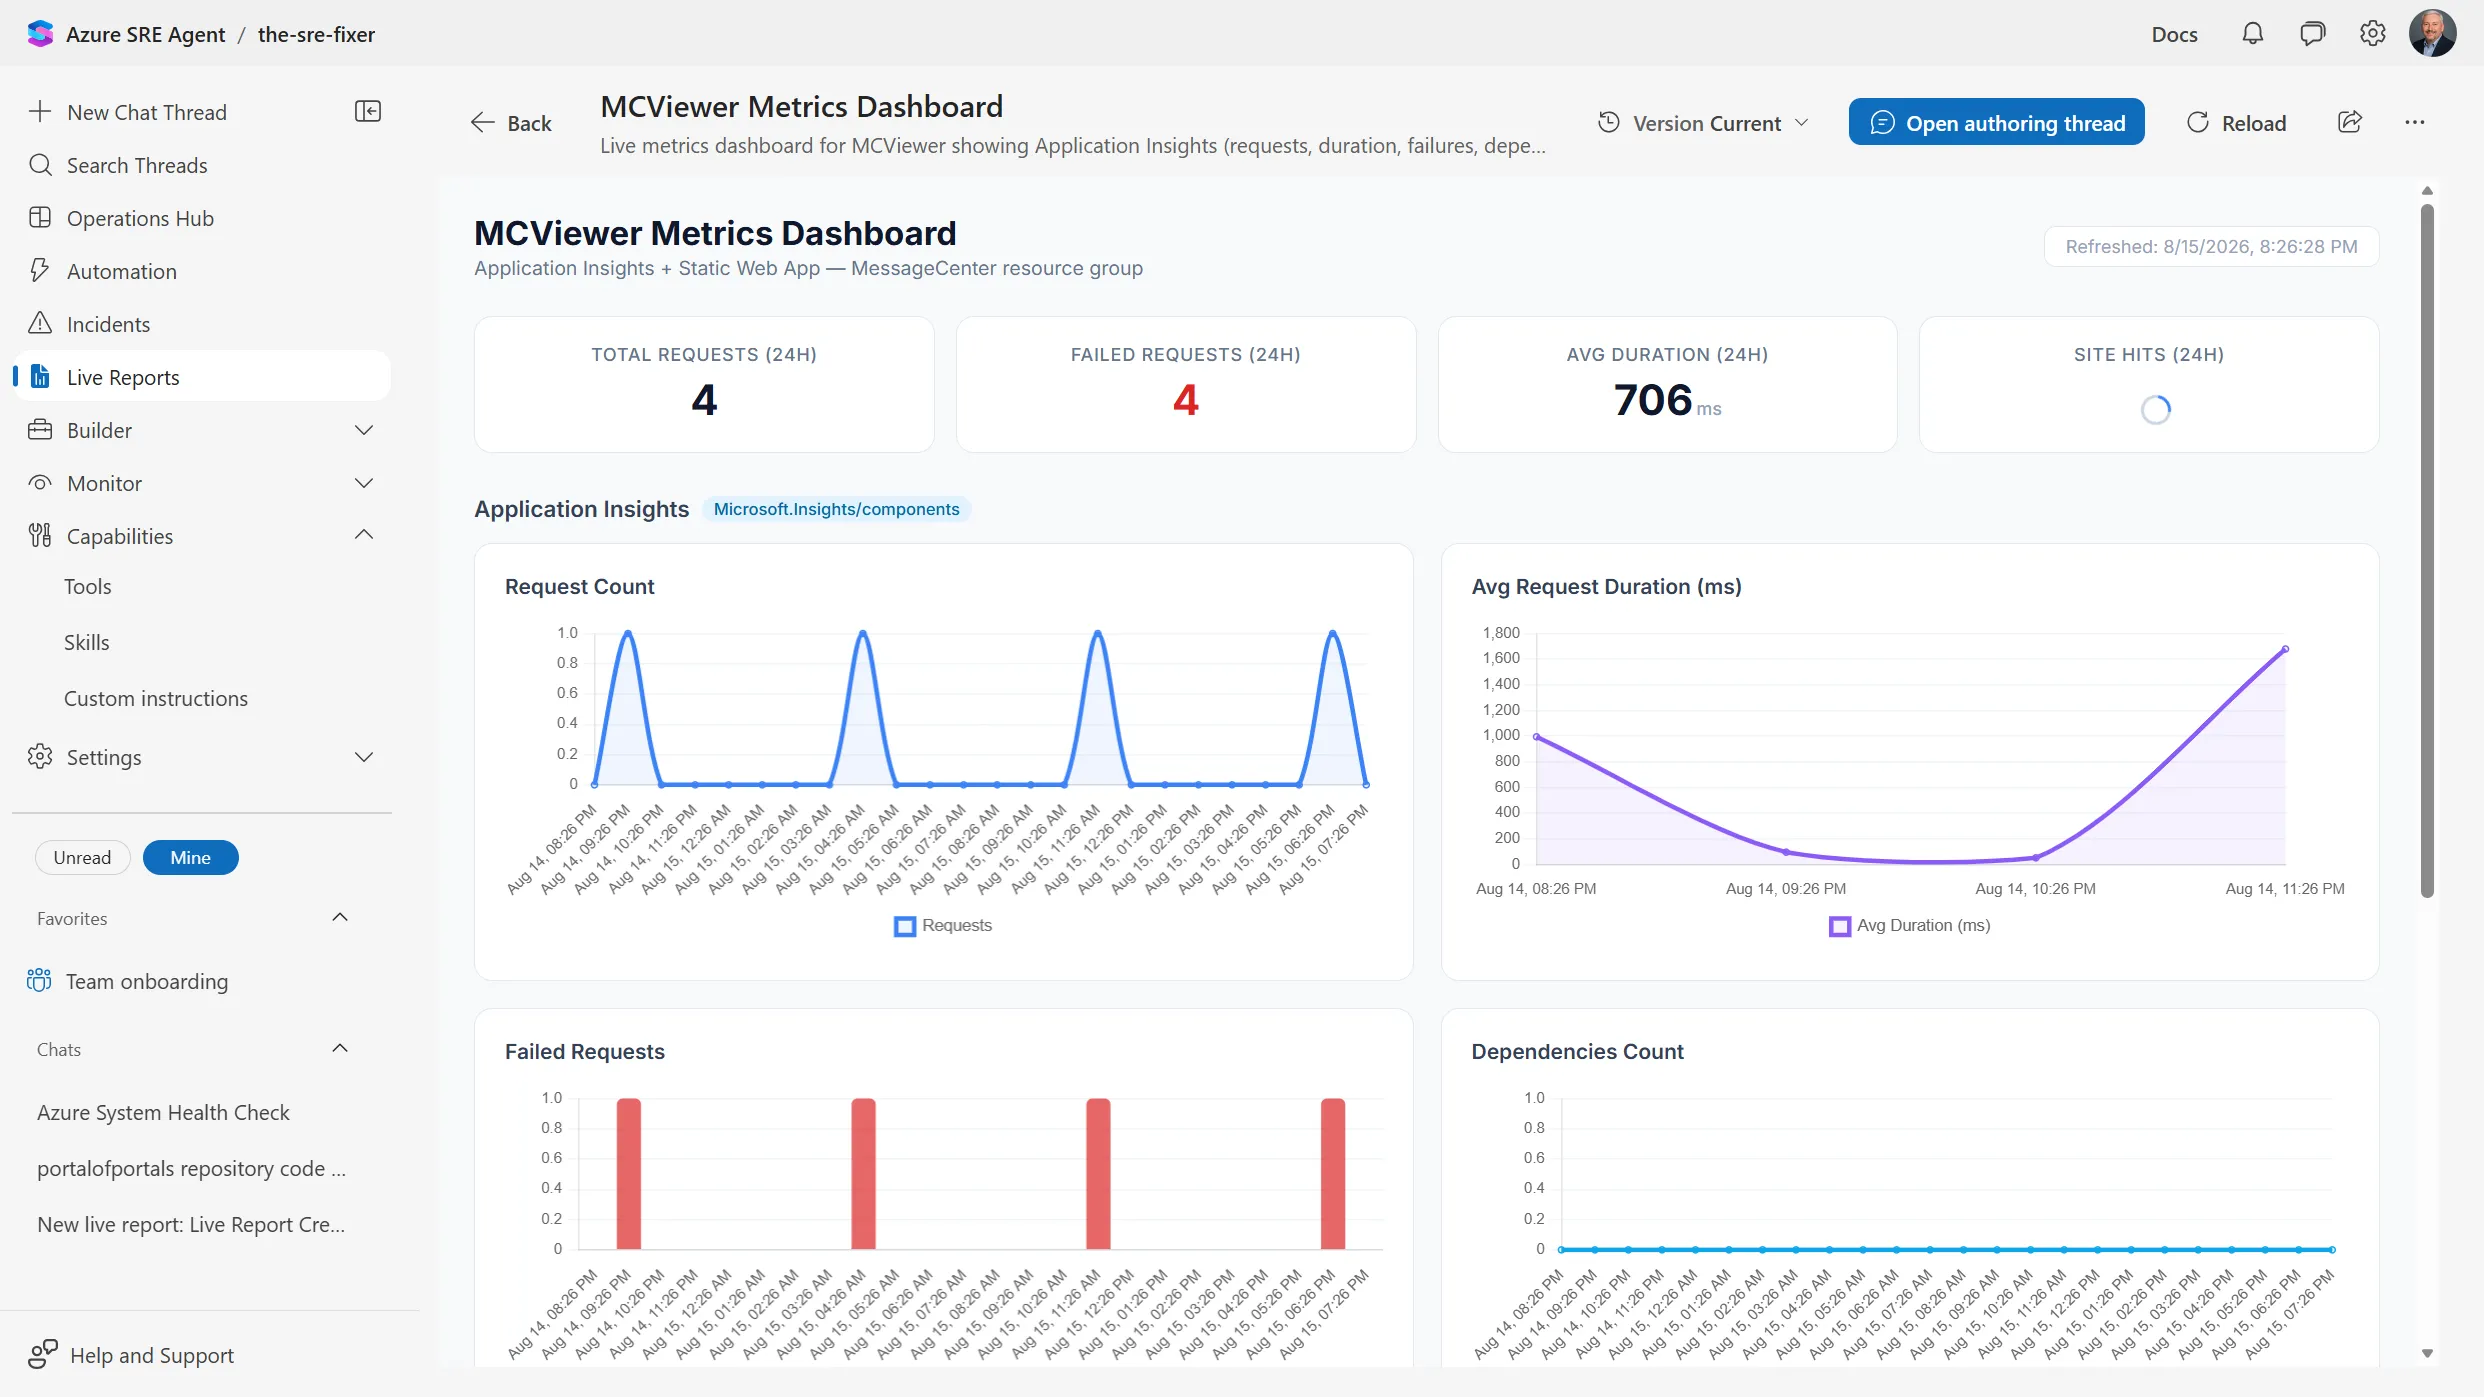
Live Reports are dashboards you build by talking to the agent. You describe what you want, it authors the report, and the report re-queries live data every time you open it. Each one is versioned and keeps a link back to the thread that created it, so when the numbers look wrong you can go read how they were defined instead of reverse-engineering a chart.
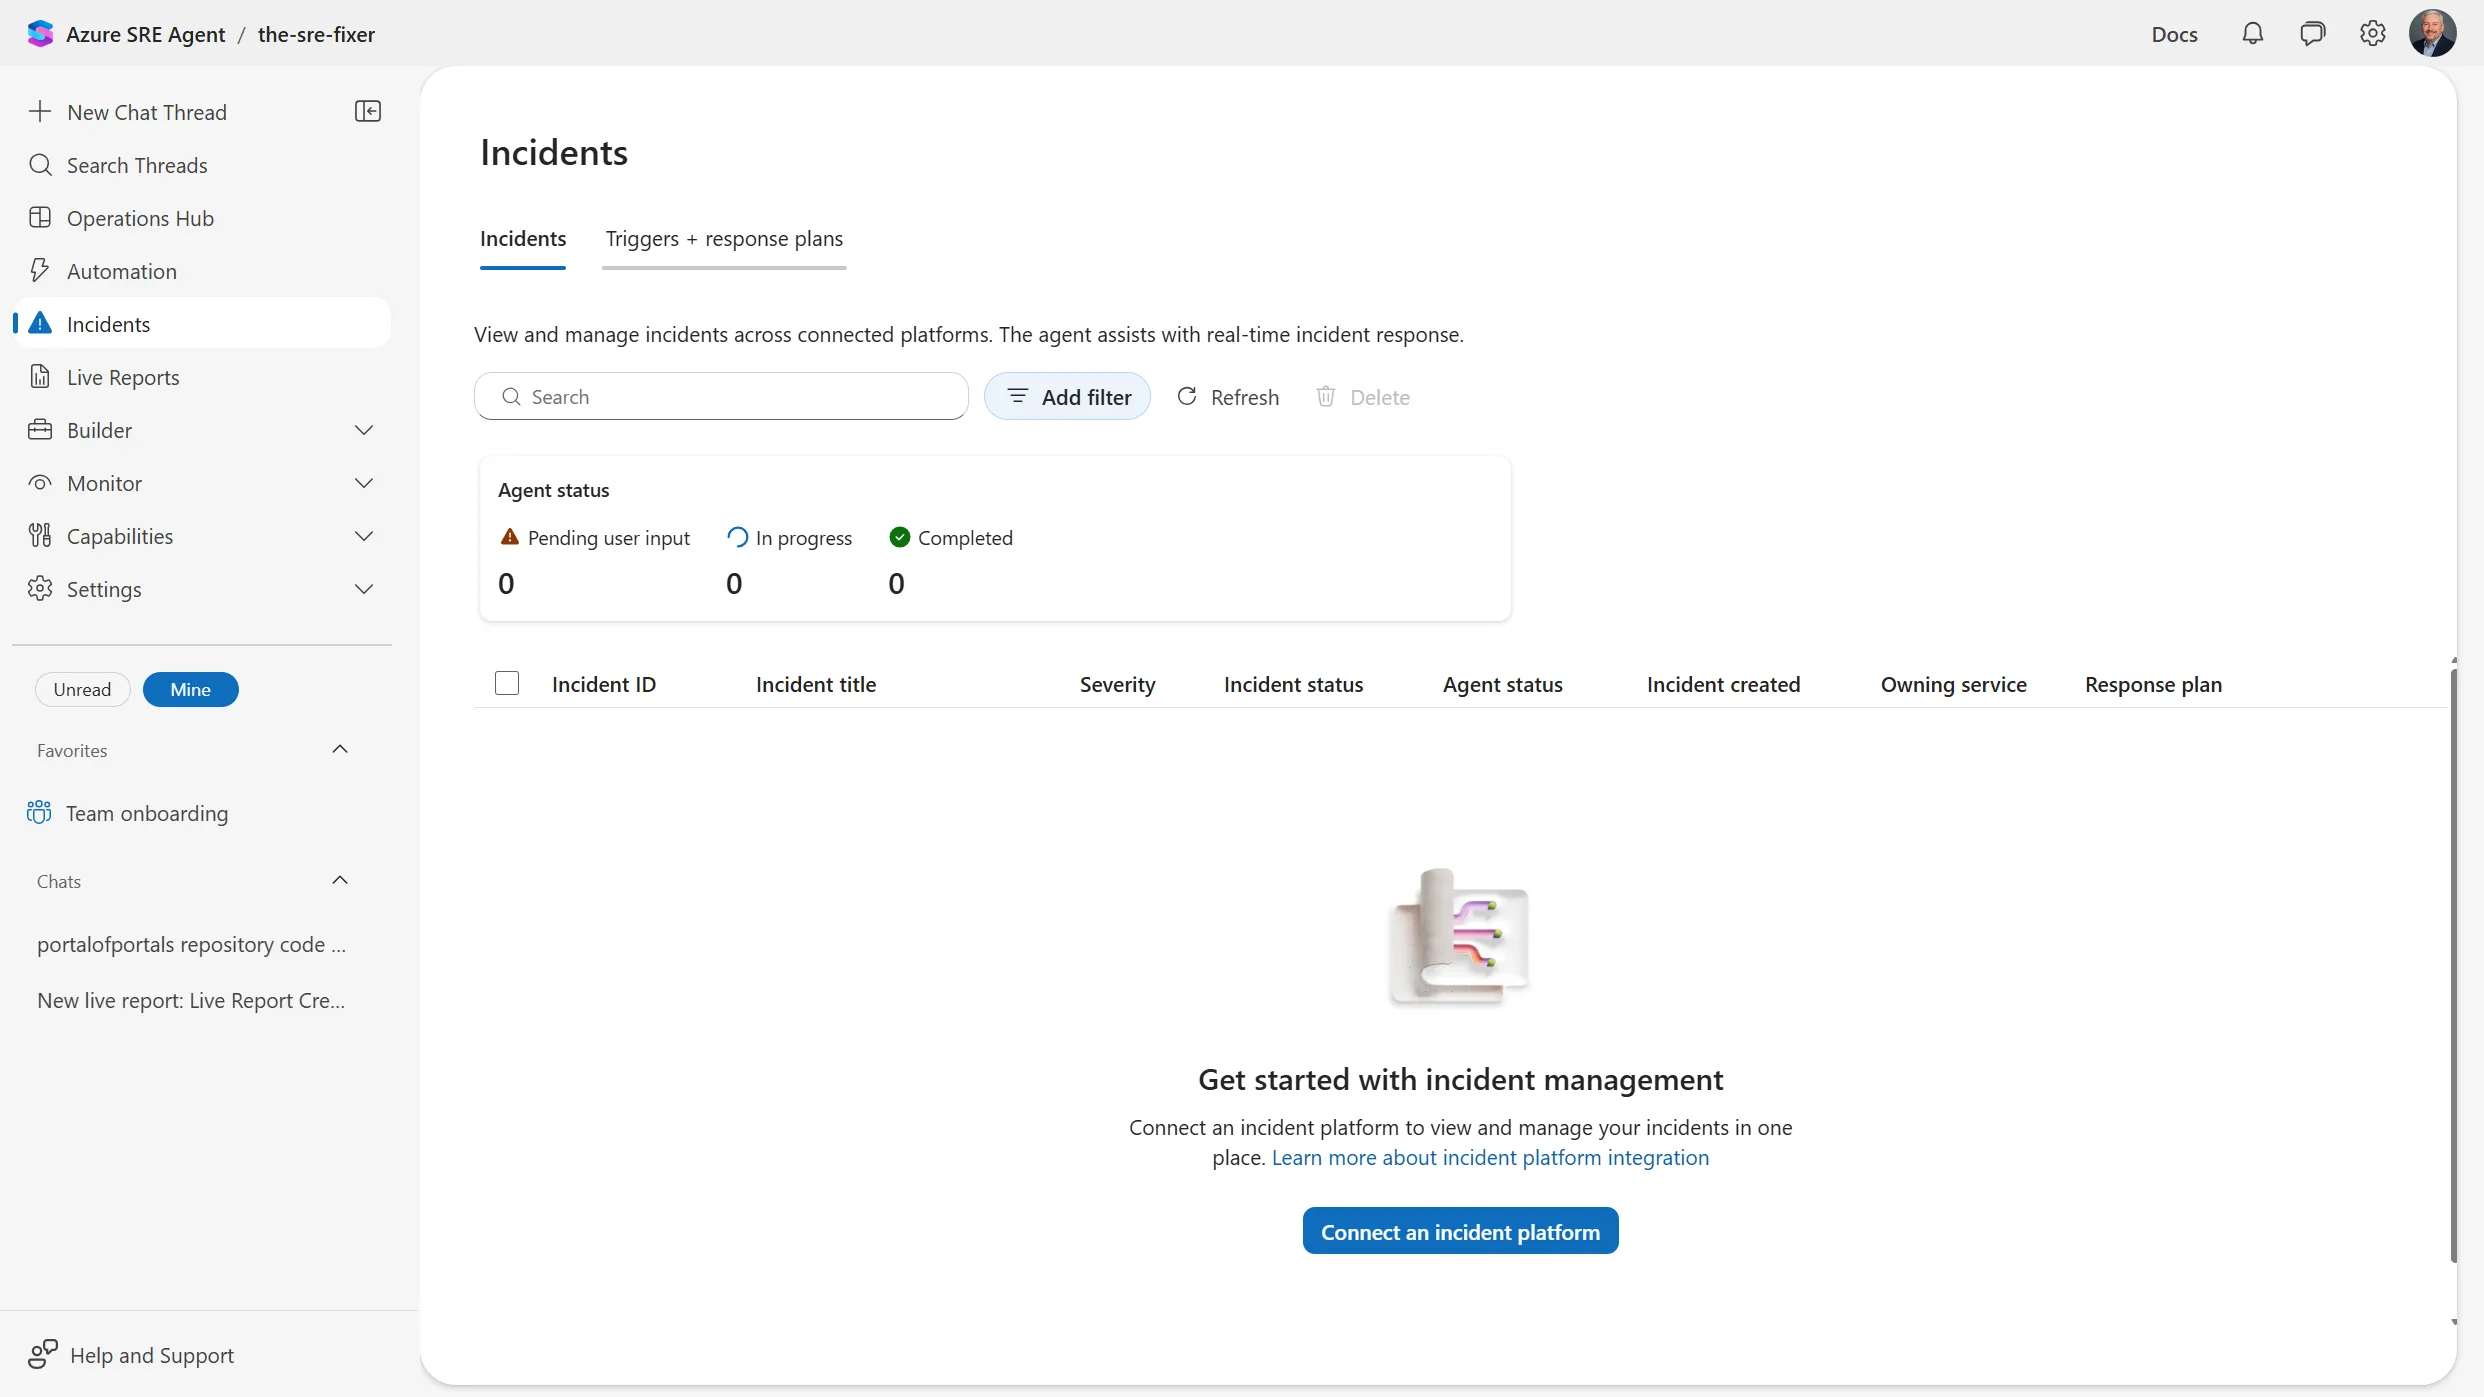
Incidents is the piece I still haven’t connected, and the portal is blunt about what that costs you: without an incident platform wired up, the agent handles conversations and scheduled work but doesn’t have a queue to work from. The same blade carries triggers and response plans, which is where the “respond automatically when this fires” behavior gets defined.
Agent Canvas is where the subagent story stops being something the service does for you and starts being something you build. You can create your own subagents and skills, wire tools to them, view the whole thing as a graph or a table, and test it in a playground before it touches anything real.
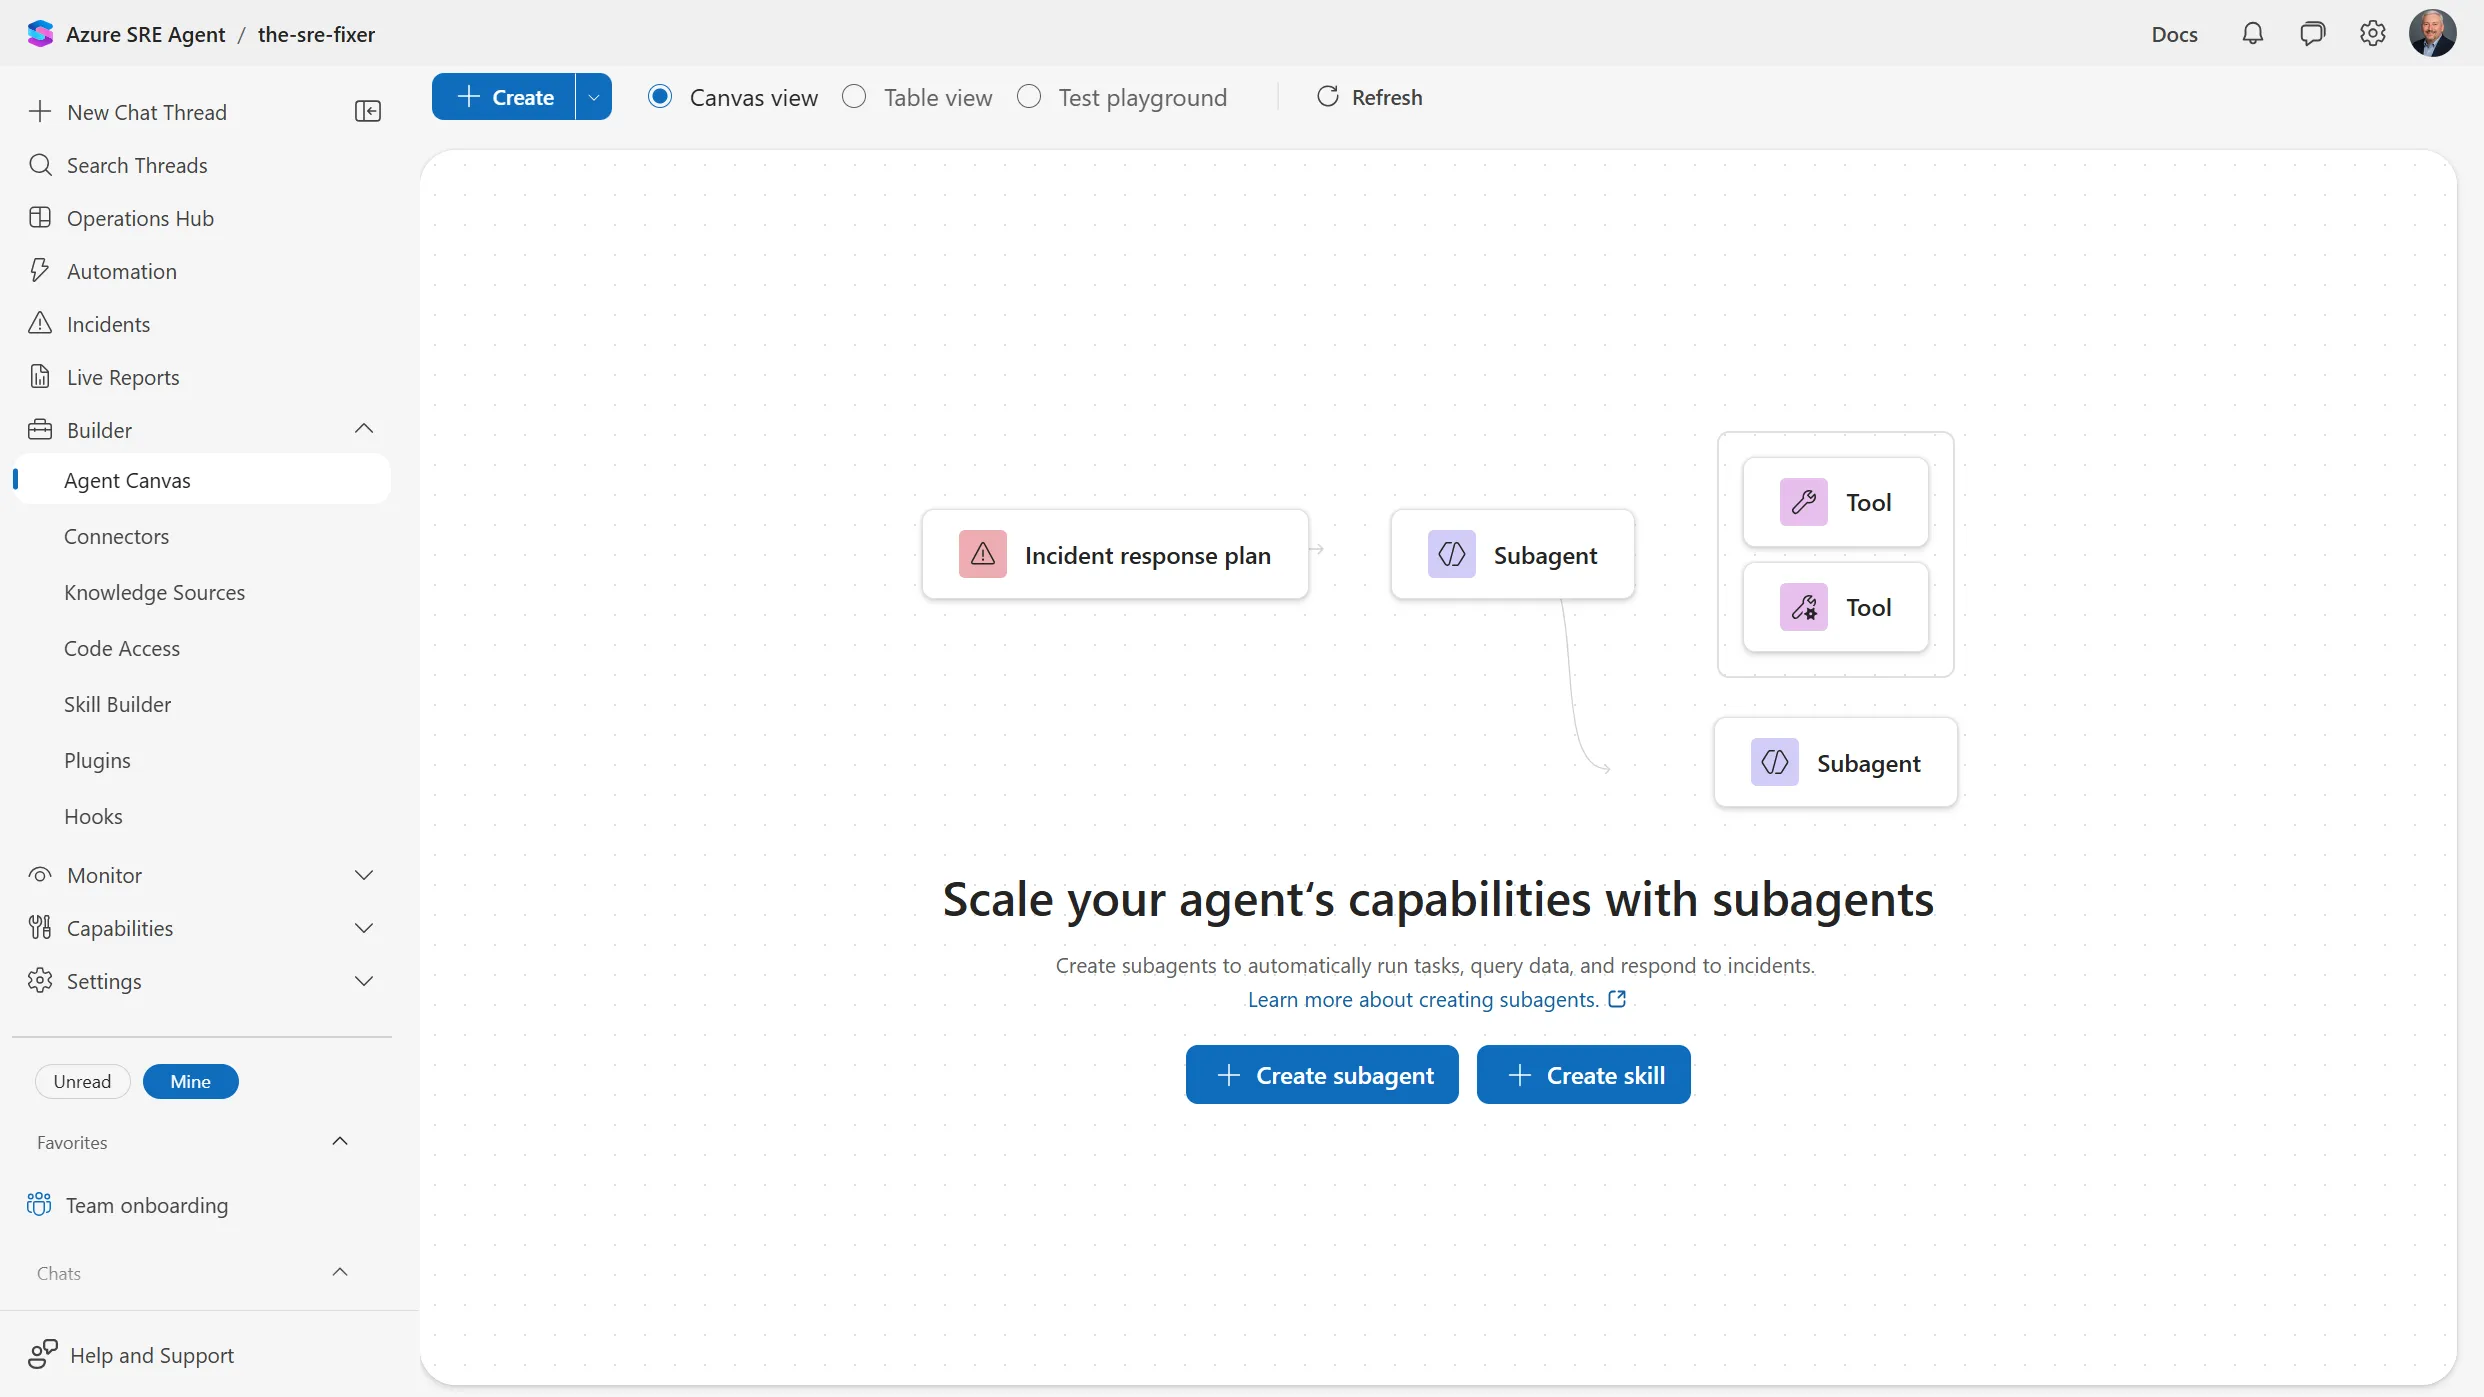
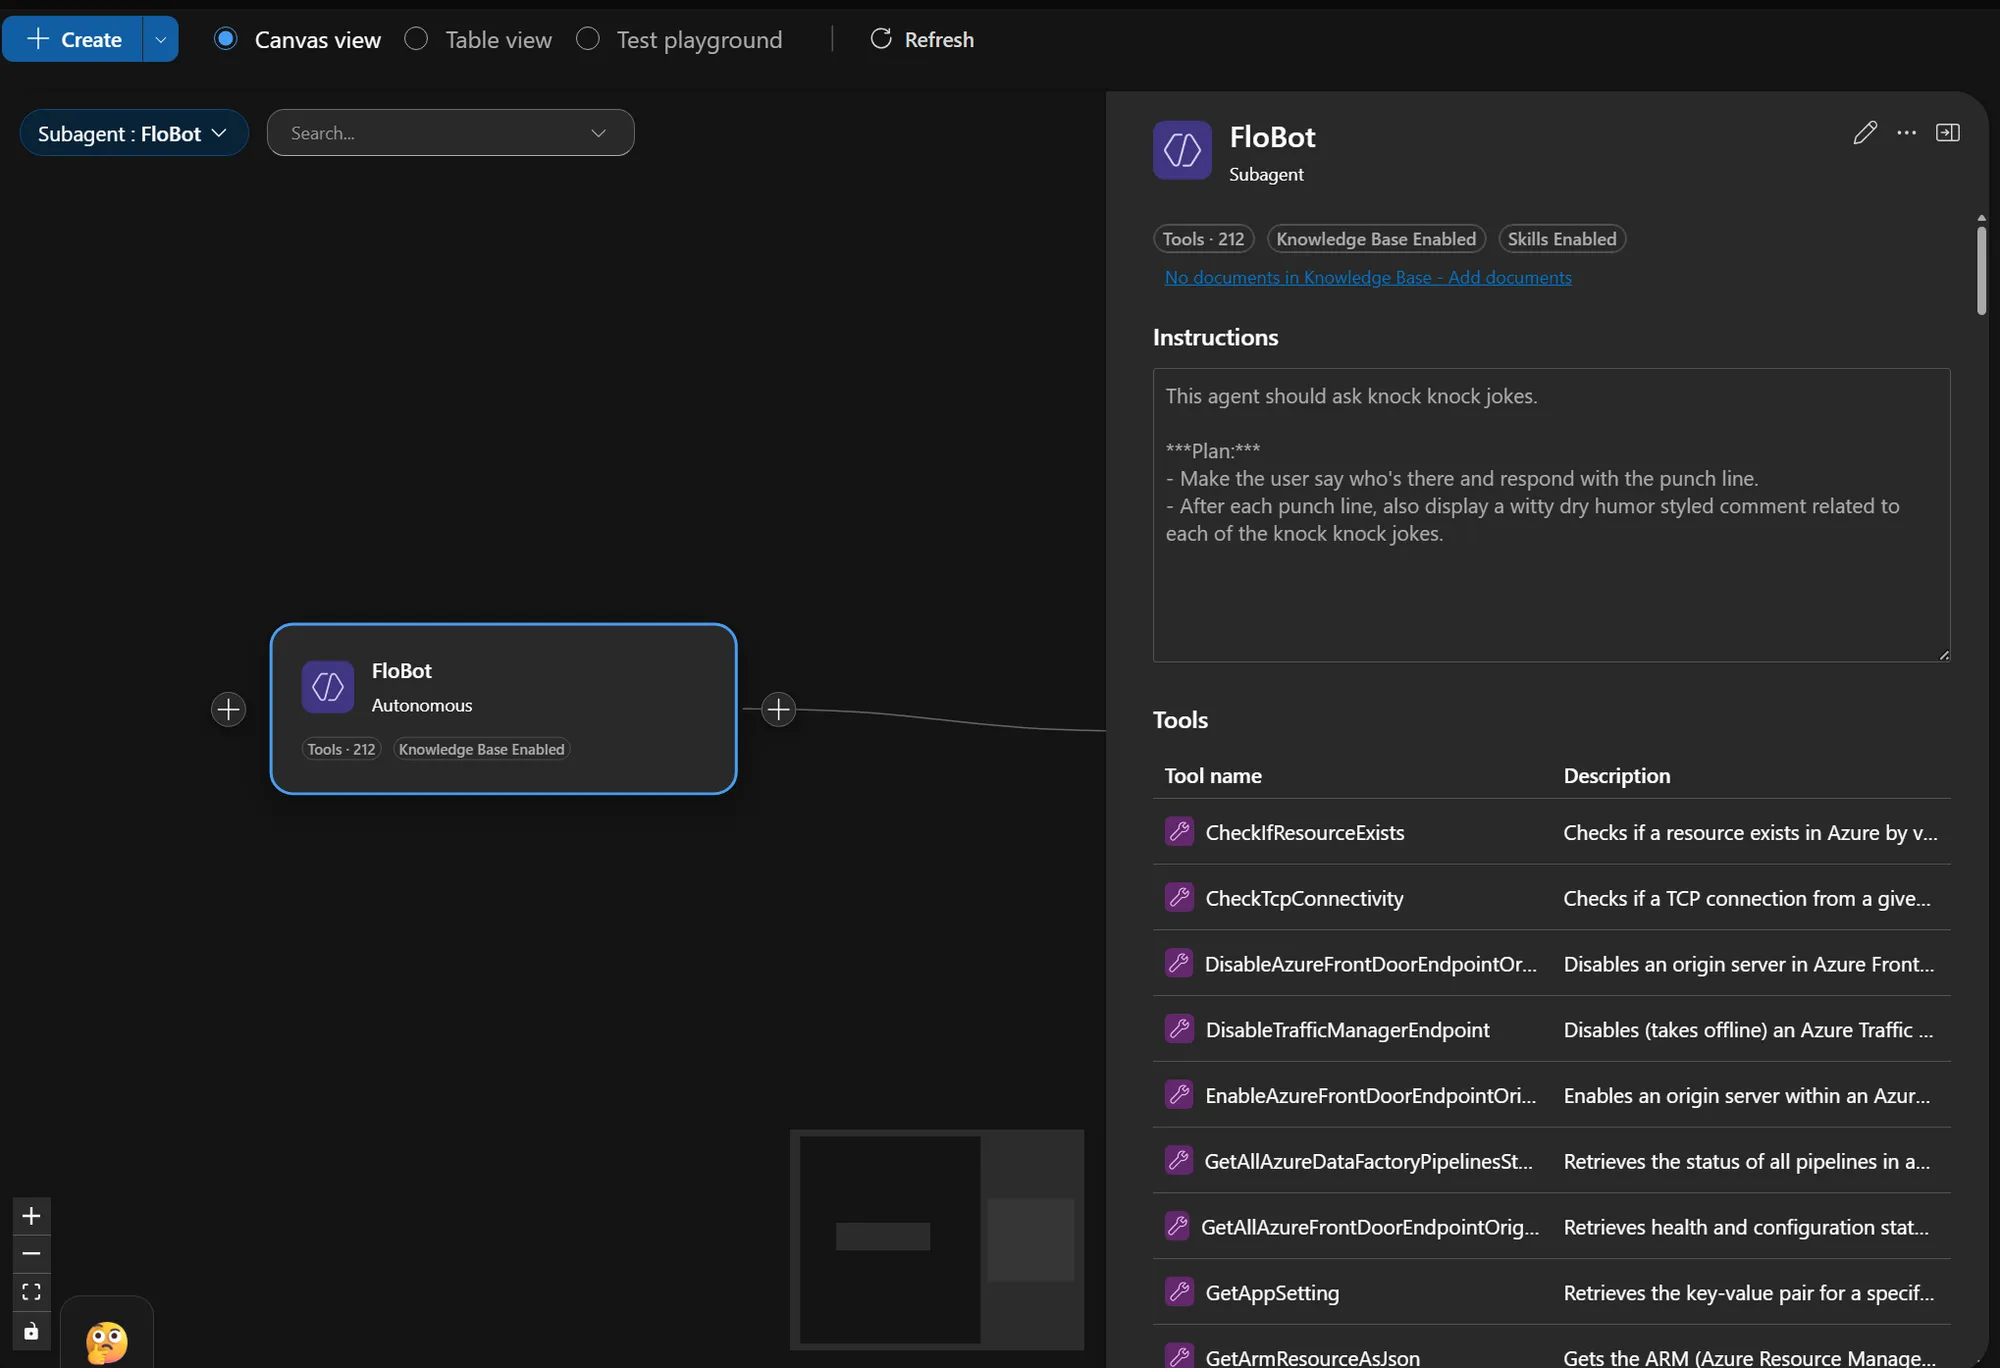
Build one and the graph fills in. A subagent carries its own instructions in plain English, its own knowledge base, and its own tool list — mine inherited all 212 tools the parent agent had available, which is the number to look at before you decide a subagent doesn’t need its own permission story. Mine tells knock-knock jokes, because I wanted to see the shape of the thing before I gave it anything real to do, and a subagent with 212 Azure tools and a sense of humor is a good argument for checking that list.
The Zero Ops guide draws a line here that I hadn’t drawn for myself, and it reframed why this blade exists. The agent you get out of the box, which the guide calls the meta agent, is versatile and non-deterministic. Ask it the same question twice and it may take different steps in a different order and format the answer differently. That’s fine when you’re exploring. It’s not fine for the incident that has to run the same way every time.
Custom agents are the what. A specialist with its own instructions, its own tools, and its own scope, invoked deliberately rather than whenever the model decides it’s relevant. Skills are the how: reusable procedures that both the meta agent and any custom agent can call, written once and available everywhere. What you’re buying with either is repeatability, and repeatability is the precondition for automation you’d be willing to leave running unattended.
The guide’s advice on writing them is the part I’d steal outright. There are two on-ramps. If you already have a runbook, hand it over and have the agent generate the skill and the custom agent from it, then review what comes back and cut a PR. If you don’t have one, work the live problem interactively, and at the moment you crack it, ask it to turn what just happened into a skill. The second path produces better artifacts, because they precipitate out of an investigation that actually worked rather than a guess at what one would look like.
What connecting Incidents actually buys you
I just told you Incidents is the one I never wired up. Then I watched the Azure Friday episode where Deepthi Chelupati walks Scott Hanselman through the full incident loop, and it reframed what that hollow circle on my setup strip was actually costing me.
Two caveats before the details. This is a demo I watched, not a run I did. And it was recorded during public preview, so the specifics have almost certainly moved. Take the shape of it, not the particulars.
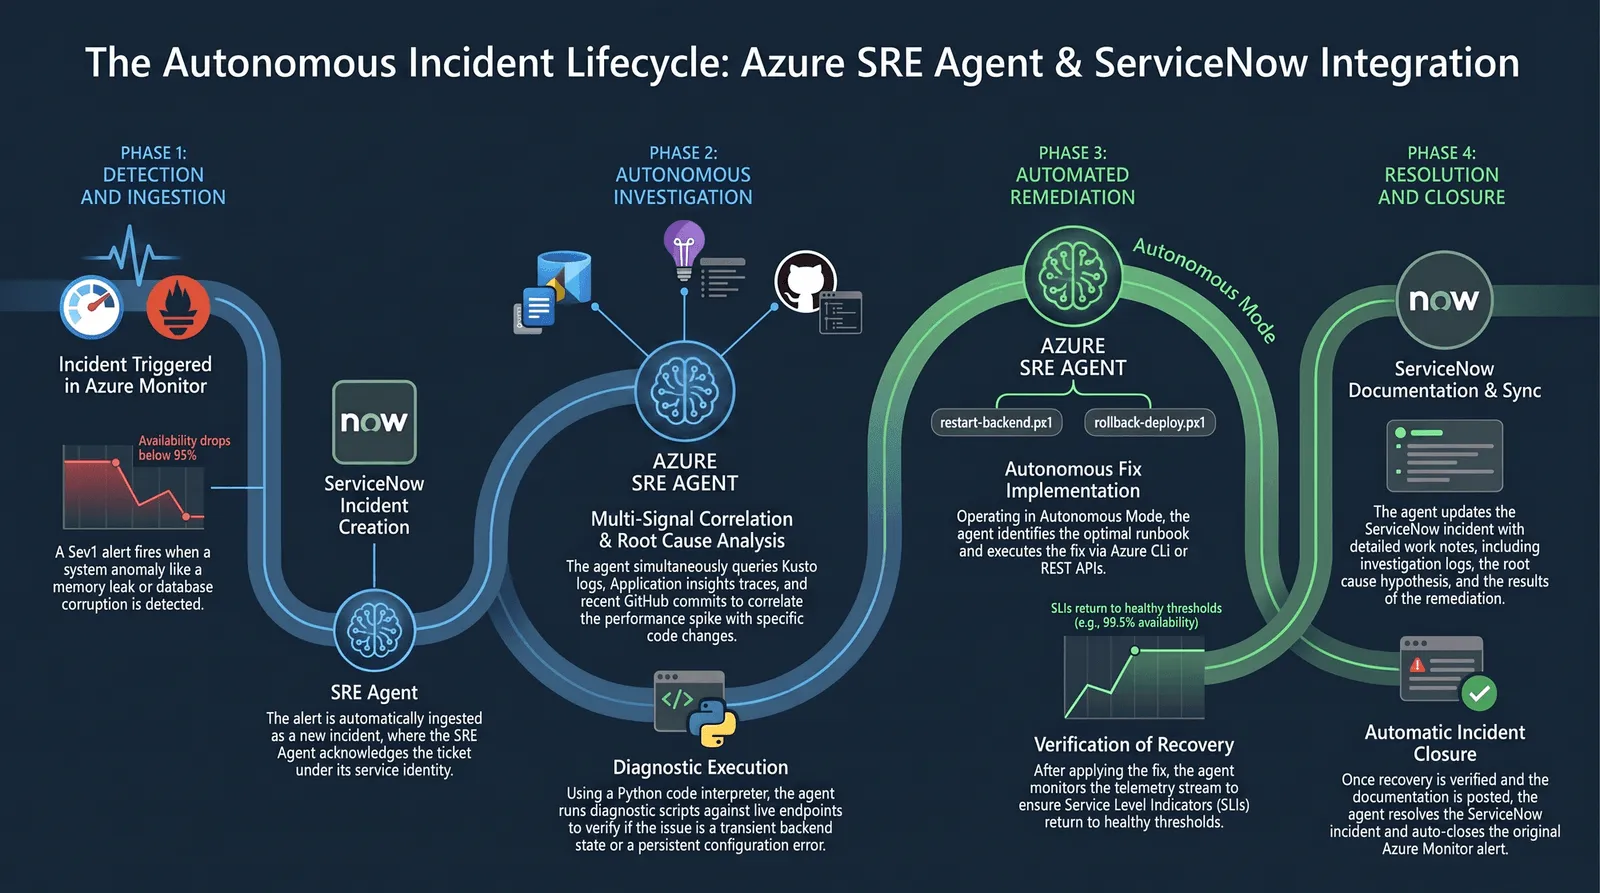
The scenario is a food-ordering app where Add to cart starts failing. ServiceNow raises the incident, SRE Agent is connected to ServiceNow, and the investigation starts before anyone’s phone lights up. Which is the whole point: everything I described earlier in this post, I had to go ask for.
The response plan is the part I’d underestimated
I gave response plans one line earlier. They deserve more. A response plan is how you tell the agent to handle a class of incident, and you write it in plain English, including any runbook you’ve been maintaining for years. The agent turns that into a structured execution plan and picks the tools it will call to carry each step out. It also ships with built-in plans for common Azure service scenarios, so you’re editing a starting point rather than staring at a blank box.
Autonomy is set per plan. Fully autonomous, or human-in-the-loop at whichever steps you care about. That’s the setting I mentioned near the top, and this is where it lives.
It diagnosed, then it actually fixed it
The order it worked in is the order a decent on-call engineer would use. Metrics first: CPU, memory, and availability all looked fine. Then application logs, where it found an out-of-memory exception. Then it correlated that against request volume to decide whether it was looking at an application fault or a platform fault, ruled out the platform, and scaled the app up.
Not proposed scaling it. Scaled it. The response plan was set to autonomous, so no human sat in the middle. If your read of this product is “it drafts and I approve,” that’s the default and it’s a good default, but it is only a default.
It also posted running updates into the ServiceNow discussion thread as it went, which matters more than it sounds like it should. If your team lives in the incident tool and gets its feed by email, they see the investigation without anyone opening the Azure portal.
Then it watched its own fix
After scaling, it kept pulling the same metrics for a window you configure, looking for whether recovery held. It came back with stable metrics and no recent 500s before it called the mitigation good.
That’s the Verification step earning its place, and it’s what most homegrown automation skips. Restarting something and declaring victory is easy. Checking whether the restart worked is the part people leave out.
The handoff to a coding agent is the headline
Mitigation isn’t a fix, and the agent doesn’t pretend otherwise. It opened a GitHub issue carrying the logs, the metrics, the evidence chain, and its root cause. Then it ran semantic search across the connected repo, matched the failure to specific source files, and pointed at the code doing the leaking. The chapter markers on the episode say Azure DevOps work items too, not just GitHub issues.
Then it assigned the issue to GitHub Copilot, and the coding agent opened a pull request removing the offending allocation.
So: alert to diagnosis to mitigation to root cause to assigned issue to open PR, with two different agents handing work to each other and a human reviewing a diff at the end. The demo ran from 5:18 to 5:34. Fifteen minutes.
The drift check is the bit nobody would think to ask for
This is my favorite detail and it’s easy to miss. Having just scaled the app in Azure, the agent went and compared the live configuration against the infrastructure-as-code in the repo, noticed they no longer agreed, and told the engineer to go fix the source so the next deployment wouldn’t quietly undo the mitigation.
Nobody asked it to do that. It’s the kind of follow-through that usually shows up three weeks later as “why did prod scale back down on its own.”
What I’d change about my own setup
Everything I ran in this post was me typing questions into a chat box. Useful, but it’s the manual mode. The incident connection is what turns it into something that works while you’re asleep, and the response plan is where the judgment goes. Mine is still an unconnected blade.
How to switch on the parts you don’t get by default
Everything above is what the agent does out of the box. The team that builds it published Harness Engineering for Azure SRE Agent in March, and the headline is counterintuitive: they got better results by taking scaffolding away. Fewer pre-written queries, fewer hand-built response plans, more raw access to code and context. Their “Intent Met” score on novel incidents, meaning the on-call engineer agreed the investigation found the real root cause, went from 45% to 75%.
Read it if you want the full story. What I care about here is that most of what made it work is a switch in the portal you already have open, and it isn’t switched on for you. Five of them are worth your afternoon.
Turn on workspace tools
File operations and terminal commands sit behind a per-agent experimental
flag. Agents created before March 10, 2026 need EnableWorkspaceTools under
Capabilities > Experimental Settings; newer ones get it by default.
These are toggles, not something the platform stamps once, so two agents in the same subscription drift apart the moment somebody flips a switch on one of them. Ask the resource rather than trusting your memory:
az resource show \
  --resource-group <resource-group> \
  --name <agent-name> \
  --resource-type Microsoft.App/agents \
  --query properties.experimentalSettings -o json
Know what the default sandbox can’t do
The article describes the agent installing packages mid-investigation and
opening PRs from the shell. The Code Interpreter you get by default does none
of that. It’s an isolated Azure Container Apps session with no outbound
network, no process spawning, no pip install, and no filesystem access
outside /mnt/data/. Pandas, matplotlib, and seaborn come preinstalled, and
that’s the deal.
Workspace tools move Python execution into the workspace sandbox where your
repo lives. That’s a different environment, not a permission bump on the same
one. Whether pip and apt come along in that sandbox is worth confirming for
yourself, so if “an agent that installs its own tooling” is why the article
grabbed you, test that before you design around it.
One thing that bites people behind a corporate proxy: the sandbox runs under
*.azuresre.ai, and some network profiles block that domain. If the portal
loads but code execution hangs, check the allowlist first.
Let it keep its own notes
Your agent keeps a knowledge directory at memories/synthesizedKnowledge/.
It’s structured Markdown the agent reads and writes with its normal file
tools, not a vector store you query. An overview.md loads into the system
prompt at the start of every conversation and links out to topic files it
reads only when it needs them.
You don’t have to wait for it to fill that in. Ask directly in chat:
Save this to your knowledge: Application Insights for the Copilot Studio
agent lives in the <resource-group> resource group, and the dependency
failures we care about come from the Foundry agent, not the app servers.
One documented consideration worth planning for: knowledge entries can go stale. When a service changes behavior, older entries can carry context that no longer applies. Budget time to review what it wrote, the way you’d review a team wiki.
The Zero Ops guide has the best partial answer I’ve read to that, and it’s plumbing rather than a feature. What the agent learns lands with the agent. Your runbook, your architecture note, your alert definition lives in the repo, and that’s the copy your humans read. So wire the automation that pushes a learning back into the original artifact as a pull request, and review it there. Skip it and the knowledge quietly forks into two versions that disagree, with neither one obviously wrong.
I haven’t built that yet. It moved up my list once I noticed the staleness problem and the two-copies problem are the same problem wearing different clothes.
There’s a related habit worth adopting before you fill that directory: don’t dump everything in. Years of accumulated runbooks and wiki pages include a lot that’s stale or contradictory, and the agent will faithfully reason over all of it. Curate to the scenarios you’re actually tackling first, confirm those are current, and grow from there.
Give it the repo
Teams pre-write log queries because they don’t trust the agent to generate correct ones, and that distrust is fair, since models hallucinate table names. The fix isn’t tighter restriction, it’s grounding. When the agent can read the code that produces the logs, it knows which exceptions get thrown and under what conditions, and it can reason about code paths nobody instrumented, which are disproportionately the ones involved in novel failures.
That’s the Code Access page I set up earlier. What I didn’t mention then is
what happens next: the agent reads your project structure, stack, and
dependencies, then opens a PR adding an SREAGENT.md file to your repo. Read
that PR properly instead of rubber-stamping it. It’s the file that shapes how
every future investigation starts.
Put a scheduled task on whatever keeps breaking
This is the easiest piece to copy and the one with the clearest payoff. Their example was mundane: LLM errors were stalling investigations, so they set up a daily task to cluster the last 24 hours of errors, trace the top offenders into the codebase, and submit a PR for an engineer to review. Errors dropped by more than 80% over two weeks.
You build that under Scheduled tasks > Create task. Task details is a prompt, so write it like one:
Query Application Insights for exceptions and failed requests in the last
24 hours across every connected resource. Cluster them by exception type
and failing operation, rank by count, and for the top three trace each one
to the specific file and line in the connected repository. Report what you
found and what you would change. Don't open a PR without asking me first.
You can be lazier than that, though. Give it a paragraph and the agent expands it into the structured version itself: goal and scope, execution steps, constraints, and the shape the output should take. The generated version is plain text you can copy to a teammate, so the good tasks become something your team shares rather than something each person rewrites badly.
The other pattern worth stealing is the one from the Azure Friday demo, and it’s aimed at prevention rather than triage: check for a recent deployment, health-check whatever it touched, and roll back if it looks unhealthy. Most incidents start at deploy time, so a task that catches a bad rollout before your users do is a better first task than error clustering. It’s also the one where I’d think hardest about autonomy, because “roll back automatically” is a production write.
The field to stop and think about is Agent autonomy level. Autonomous is the default and lets the agent act without approval, which is not where I’d start. Run it in Review mode, use Run task now to watch it once before it runs unattended, then check Monitor > Session insights, where symptoms, root cause, and pitfalls get pulled out of each thread with a link back to the conversation.
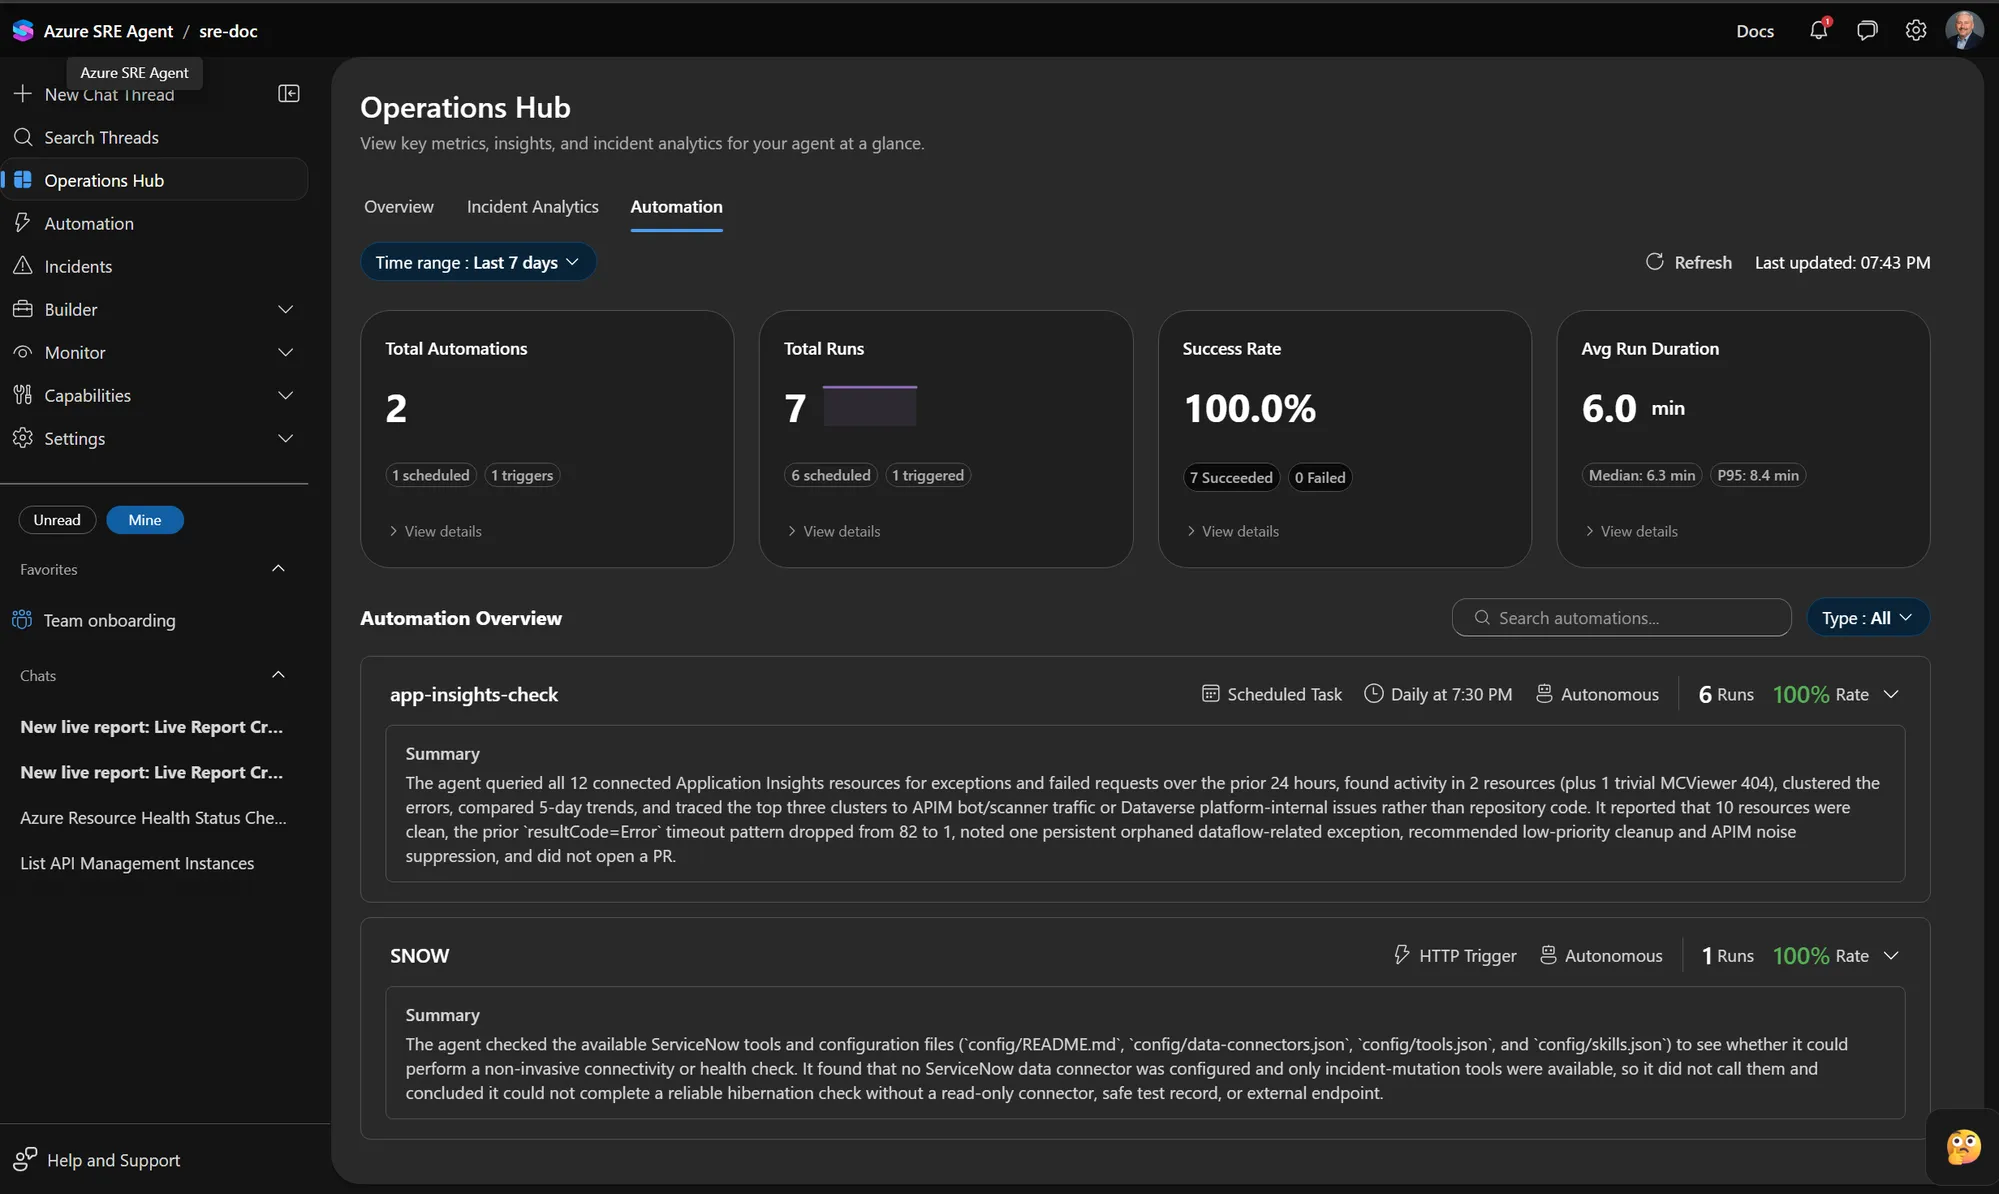
Once a few of these are running, the Automation tab in the Operations Hub is where you find out whether they’re earning their keep. Totals, success rate, and run duration across a time range you pick, and each automation expands into a plain-English summary of what its last run actually did. Mine reports a daily Application Insights check that queried 12 connected resources, found activity in two, compared five-day trends, traced the top clusters to bot traffic and platform-internal issues rather than my code, and explicitly noted that it did not open a PR. That last clause is the one I’d check first. A summary that tells you what it decided not to do is how you audit a task you’ve left running unattended.
What doesn’t transfer
Worth naming the ceiling. That post is about how the team engineers its own harness against its own source, telemetry, and deployment history, and the numbers come out of that specific setup. What transfers is the shape: give it your repo, let it keep its own notes, put a scheduled task on whatever keeps breaking, and stop pre-writing the queries you don’t trust it to write.
Their closing line is the one I’d underline. They went from an agent that follows your playbook to one that writes the next one. Mine isn’t there yet. But every piece that would get it there is a switch in a portal I already had open.
What the Zero Ops guide is actually arguing
The thesis fits on a line: agents operate, humans govern. The useful part isn’t the slogan, it’s the ladder underneath it, because what changes at each rung isn’t how clever the agent is. It’s what a human reviews.
At Crawl it suggests and you do the work, so you review your own work. At Walk it acts one step at a time and you approve each step. At Run it completes whole tasks and you review the diff. At Fly it fixes, deploys to test, validates the outcome itself and posts the evidence, and you review the outcome rather than the diff.
Everything in this post is Crawl and Walk. That’s the honest read on my setup, and the guide is direct about why teams stall there.
Triggers promote you, not capability
This is the line that landed hardest, because it describes me exactly. A brilliantly capable agent that only ever runs when somebody opens a chat window is permanently at Walk, no matter how good its answers are, because a human is still starting every piece of work. Capability doesn’t promote you. Wiring does: response plans bound to an alert class, scheduled tasks on a rhythm, and HTTP triggers for everything else in your ecosystem that wants to start agent work.
I have the Automation blade configured and I still spent this entire post typing questions into a box. The distance between those two facts is the distance between Walk and Run.
Two loops, and a safety net that isn’t the agent
Once agents work real incidents, the guide’s advice is to stop making the routing a judgment call. Run an agent loop and a human loop, register every incident class to one of them in advance, and make promotion between them a reviewable change with a written gate, plus a written demotion trigger for when a class stops earning its place.
The part I’d underline is where the safety net lives. It belongs to your incident platform, not to the agent. Define the conditions your process cares about, whether that’s not acknowledged in x minutes, not mitigated, or not handed off, and let the incident system escalate when they’re breached. An agent that has stalled can’t be relied on to report that it has stalled, so something outside it has to notice. That’s the same argument I made about the VNet earlier: a boundary that depends on the component behaving correctly isn’t a boundary.
Escalation should also carry the work with it, so the human who gets pulled in arrives to evidence already gathered rather than a blank page and a timestamp.
Self-healing gets scoped the same careful way. It’s granted per alert class, never per service. You pick the class, you enumerate the safe actions, and the agent’s contribution is doing that work correctly at 3 a.m. without waking anyone. Running one class at full autonomy while another sits deliberately at zero isn’t inconsistency. It’s the control working.
Measure cost per outcome, and failures per tool
Two measurement habits worth copying on day one.
Price the outcome, not the month. Agents burn metered units and every unit maps to work, so you can finally answer “what did that incident cost” with a real number instead of a shrug. Total spend rising while cost per resolved outcome falls is what success looks like, and you’ll misread it as a problem if you’re only watching the invoice. Set a consumption budget deliberately, and find out who can raise it before it’s 2 a.m. and you need them.
Then track tool failure rate per tool rather than in aggregate. The guide’s field note is that aggregate success across large estates usually sits above 98%, which reads as fine while hiding the one connector with a stale token that’s been failing every call for a fortnight. The aggregate is the number that makes you comfortable. The per-tool breakdown is the number that finds the bug.
Evals as a standing job, not a gate
The reflex is to treat evals as a pre-production check: test the skill, it passes, ship it, done. The guide argues the larger half of the value is continuous, scoring real production runs on whether the agent stayed in scope, reached the right conclusion, and stopped to ask when it should have. Then wire a scheduled task to the eval signal so a degradation turns into work rather than a report nobody opens. Real traffic finds problems a fixture never will, and it finds them on your estate rather than someone else’s.
One more thing that belongs in source control
The guide treats the entire agent configuration as code, and that part is real and documented rather than aspirational. The microsoft/sre-agent repo ships templates for four deploy backends, Bicep, Terraform, PowerShell, and the Azure Developer CLI, along with prebuilt recipes for common setups like Azure Monitor, PagerDuty, and Dynatrace. So the skills, custom agents, and settings you tuned on a dev agent can be promoted through the same pipeline as everything else, and rolled back by reverting a commit instead of by remembering which toggle you flipped.
That’s also the answer to the drift problem I hit with experimental settings a few sections up. Two agents in one subscription stop diverging when their configuration comes from a template rather than from whoever had the portal open last.
Where that leaves mine
Crawl and Walk, honestly. Good answers, a repo connected, two automations running, and a human starting nearly every piece of work.
The three things I’m doing next are all small, which is the guide’s actual argument. Wire one response plan to one alert class I already understand, so something starts without me. Add the pull request loop that pushes what the agent learns back into the runbook in my repo. And put the agent configuration in a template, so the next agent I create doesn’t drift from this one on day one.
None of that requires the agent to get smarter. That’s the part it took a long design guide to make obvious.
Get the latest learnings
Occasional notes on Azure, AI, and cloud architecture. No spam, unsubscribe anytime.
Related articles
Finding GitHub Copilot Harness Agents Before PPAC Shows Them
The Power Platform admin center still doesn't flag which Copilot Studio agents run on the GitHub Copilot harness. The isCLIAgent property does, and Microsoft has now published governance guidance built on it.
Publish Foundry Agents to Teams Behind a Private Endpoint
Disabling public network access removes the Foundry portal's Teams publish button. Here's the REST path that replaces it and the inbound design you now own.
Sync ALL your Copilot Studio conversation transcripts to a single location
Compare Copilot Studio transcript replication through Fabric and Azure Functions, with practical guidance on retention, identity, parsing, and Power BI costs.
Comments
Comments are hosted by GitHub Discussions. Loading them connects your browser to giscus.app and GitHub.